
August 2025 Newsletter
During the fourth quarter of 2025, TimesSquare proudly celebrated 25 years of Quality Growth Investing. Throughout this time, we have stayed committed to our core investment philosophy while continuously learning, improving, and evolving as a firm.
Firm Updates
Congratulations to the following team members on their well-deserved promotions. On July 1st, we also welcomed two new members to the Research Team.
Promotions
- Edward Salib: Portfolio Manager - U.S. Mid Cap Growth & FOCUS Growth (23 years at TSCM)
- Gregory Vasse: Portfolio Manager – U.S. Small & SMID Cap Growth and Global Small Cap (17 years at TSCM)
- Jacob Troutman: U.S. Research Analyst – Business & Information Services and Energy (12 years at TSCM)
- Margot Waldron: U.S. Research Analyst – Health Care (4 years at TSCM)
New Hires
- Adam Krasner: U.S. Research Analyst – Financial Services
- Ryan Williams: U.S. Research Associate – Industrials & Consumer
Navigating Small Cap Biopharmas
Executive Summary
Investors are historically wary of small cap biopharma given the need for technical knowledge and the potential for high volatility, concerns that are clearly validated by market data. In this paper we detail our approach for navigating biopharma with technical expertise and through a quality growth lens that has resulted in a successful approach over the past decade.
Russell Reconstitution – Notable Takeaways
Mid Cap Growth – Russell Mid Cap Growth
- Palantir & AppLovin graduated out of the index, causing Information Technology ‘s weight to drop -1076 bps (the biggest sector change in recent memory) with most reallocated to Consumer Discretionary +818bps.
- The number of stocks in the growth index decreased to 276 (of 800 mid cap index names) with the top 10 over 22%, making it more concentrated than ever.
Small Cap Growth – Russell 2000 Growth
- Impact to the small cap growth index was minor with the greatest changes to Industrials -333bps and Financials +220bps.
- The largest small cap index name had a market cap of $15.8bn, up from $10.5bn after the 2024 reconstitution.
-
Market Overview (2Q 2025)
In the second quarter, there were double-digit returns for equities as global economic activity measures lifted into expansion territory. However, there were many tremors across the economic landscape, with Washington, D.C. at the epicenter.
- At the start of April, the U.S.’s proposed tariff regime led to significant economic fallout. Global markets whipsawed in the ensuing tariff tantrum and subsequent de-escalations to the point that later tariff announcements were often discounted quickly.
- There were further disruptions later in the quarter as the Trump administration’s budget bill weaved through Congress (approved just after the quarter ended). Most notable were permanent and expanded tax cuts, along with net reductions in fiscal spending—especially Medicaid.
- Markets showed their concerns as U.S. treasury yields rose, and the dollar fell against other major currencies.
Equities seemed unfazed as the U.S.’s Russell 3000® Index rose 11%, keeping pace with the 12% returns for the MSCI EAFE and MSCI Emerging Markets Indexes.
- Growth indexes outpaced value indexes in all regions and size ranges.
- Among global risk factors, Beta, Momentum, and Residual Volatility were highly rewarded, while Earnings Quality, Value, and Growth were punished or ignored.
- Within U.S. small and mid capitalization growth indexes, better returns came from stocks with either high valuations, negative earnings, or low returns on equity.
Analyst Updates (2Q 2025)
As our investment team meets with companies; dissects recent earnings reports; and reviews the global landscape, they reflect on several investment dynamics in various market segments that guide our positioning:
General — We saw companies across most areas either scrap or significantly reduced forward guidance. As they wait to see how near-term results fare in this environment, we believe some have lowered expectations to levels that can be surpassed in future quarters.
Consumer — With so many consumer goods potentially subject to tariffs, measures of confidence and sentiment remained at trough levels. Some customers advanced their purchases ahead of expected price hikes. Companies with better balance sheets increased their inventories during tariff pauses, which should provide them with opportunities for greater market share later in 2025.
Financials — Although M&A activity began unexpectedly slowly this year, there were early signs it was accelerating. As equity market levels climbed following initial recession fears, capital markets and trading firms recovered sharply with continued growth in fundamentals.
Health Care — Reduced Medicaid spending weighed on volume levels and growth across the sector. Changes at the FDA slowed regulatory approvals, which combined with the Trump administration’s rhetoric for lower drug prices and onshore production, have dampened enthusiasm for the biopharma industry.
Industrials — Many companies are understandably conservative with their outlooks as tariff levies are quickly announced and rescinded. That favored longer cycle secular end markets—such as aerospace & defense, datacenter related, and infrastructure—compared to the short cycle cyclical areas of transportation or consumer related. Though if the Federal Reserve becomes more dovish, the recent industrial laggards could return to favor later in 2025.
Information Technology — As with other segments, anticipation of higher prices from tariffs led to a short-term surge of orders across the semiconductor industry. Offsetting that was the rebound in spending for all things AI related, which had been weak in the first quarter following DeepSeek’s emergence. One notable confirming data point for the AI megatrend was Ford Motor’s CEO predicting that “artificial intelligence is going to replace literally half of all white-collar workers in the U.S.”
Navigating Small Cap Biopharma
David Ferreiro, Ph.D., Portfolio Manager
Health care, particularly biopharma, stands as one of the most dynamically innovative sectors in the global economy, serving as a beacon of scientific advancement that continuously reshapes the landscape of medical treatment and patient care. Since the groundbreaking Human Genome Project published its first working draft in 2000 and achieved its monumental completion in 2003, we have witnessed an extraordinary acceleration in biopharma innovation that has fundamentally transformed the practice of medicine.
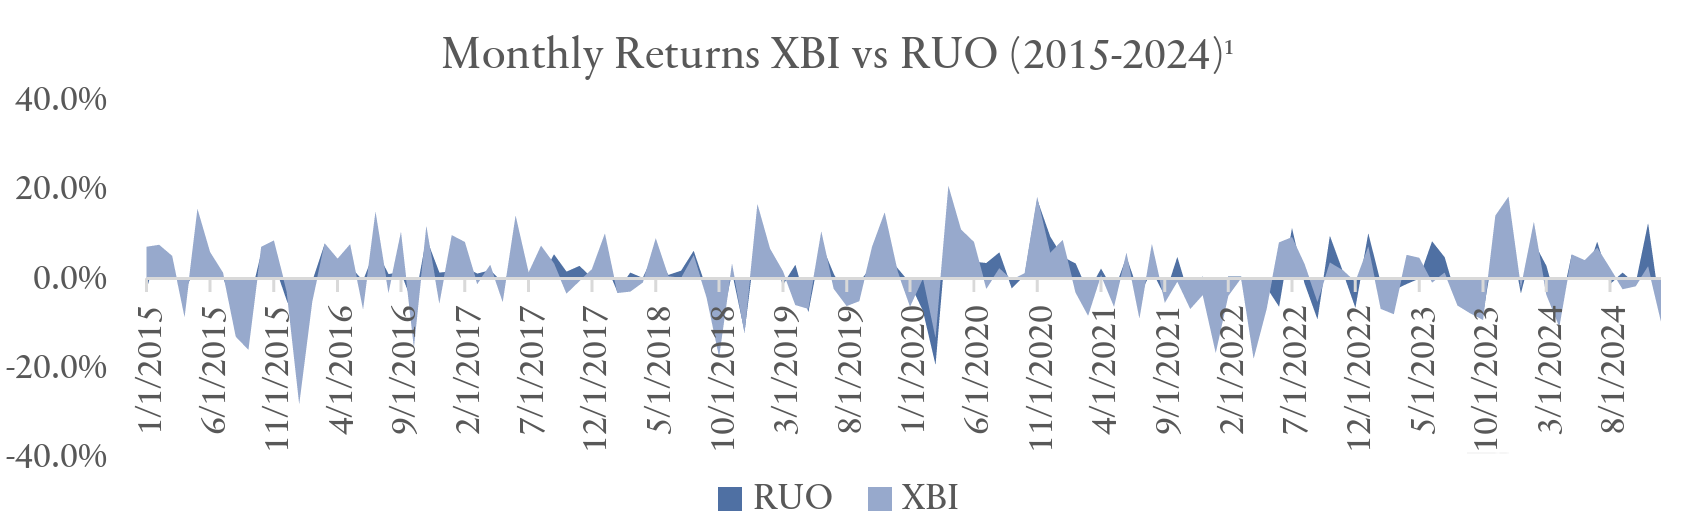
Investors are historically wary of small cap biopharma given the need for technical knowledge and the potential for high volatility, concerns that are certainly validated by market data. As illustrated in the accompanying chart¹ showing monthly returns from 2015-2024, the XBI index (an equal-weighted S&P biotech ETF) demonstrates significantly higher volatility compared to the Russell 2000® Growth Index (RUO), with annualized volatility of 29.55% versus 21.16% respectively. This 40% higher volatility in XBI is statistically significant and highlights the notable risk that many investors face. Since XBI is an equalweighted index that includes larger cap biotech companies, small cap biotech investments would be expected to exhibit even greater volatility than these already elevated levels. This combination of technical complexity in evaluating drug development pipelines, regulatory risks, and the extreme price volatility evident in the data explains why many investors approach the sector with considerable caution, despite its potential for outsized returns during favorable periods.
The Small Cap Opportunity in Biopharma
Despite the inherent risks and volatility that characterize small cap biopharma investments, several compelling structural factors make the industry increasingly attractive for long-term investors. The convergence of powerful demographic tailwinds, including a rapidly aging population and rising obesity epidemic, coupled with health care expenditures consistently outpacing GDP growth, creates sustained demand for innovative therapeutic solutions that biopharma companies are uniquely positioned to deliver.
Furthermore, the high cost of drug development, long regulated development processes, highly regulated supply chains, and intellectual property patent protection provide significant barriers to entry. In addition, novel green field market opportunities such as first-in-class therapies in new disease markets enjoy substantial and quantifiable advantages that create lasting competitive moats. Over the last 5 years, small cap biopharma has been a primary source of innovation with ~65% market share² for new drug launches.
Our Approach to Investing in Small Cap Biopharma
As quality growth managers, we employ a rigorous investment process that has been refined over the past 20 years. It focuses on three core pillars for identifying companies: distinct, sustainable competitive advantages, quality management teams, and strong consistent growth profiles. Within the small cap biopharma universe, where the developmental, high-risk, and cashburning nature of these companies scares many fundamental growth managers away from the sub-sector, we have applied a rigid investment process to find companies that fit our investment criteria. This process centers on identifying companies developing first-in-class therapeutics that represent true greenfield opportunities in areas of significant unmet medical needs. We look for rare disease opportunities and targeted therapeutics that address specific patient populations with precision, and novel drug targets in large disease areas where traditional approaches have failed. We place particular emphasis on management quality given the complex developmental pathways and regulatory interactions inherent in drug development, recognizing that successful drug approval requires exceptional leadership with a clear vision for navigating the intricate regulatory landscape from preclinical studies through clinical trials to FDA approval.
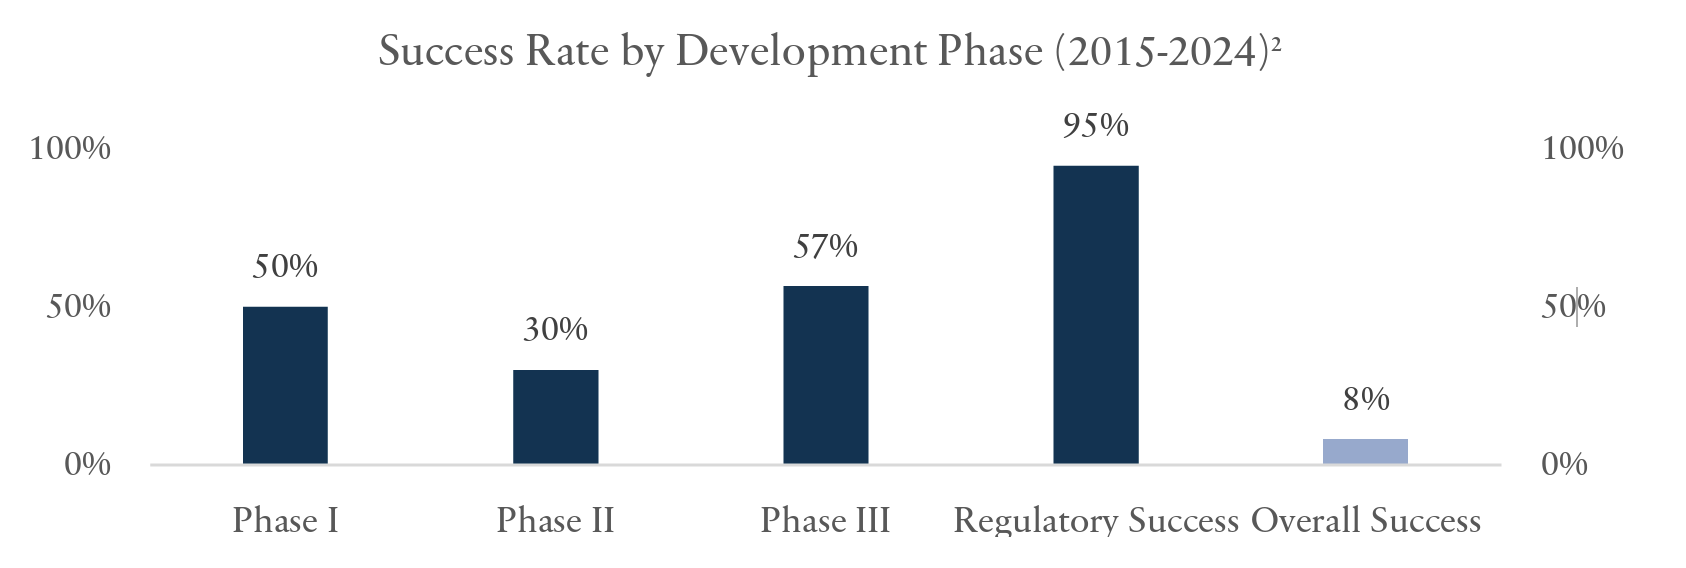
Small cap biopharma investing presents a distinctive risk-reward proposition shaped by the inherently challenging nature of drug development, where the overall success rate² from initial discovery to market approval hovers around just 8%. We focus our attention on companies that have successfully navigated past the proof-of-concept stage, particularly those with Phase II data in hand. Phase II represents the most critical inflection point in drug development, where success rates² plummet to just 30% thereby supporting our strategic approach. By concentrating on post-Phase II opportunities, we can avoid the highest attrition phase while still capturing significant upside potential, as companies with validated proof-of-concept data face substantially improved odds of 57% and 95% success rates² in Phase III and regulatory approval, respectively.
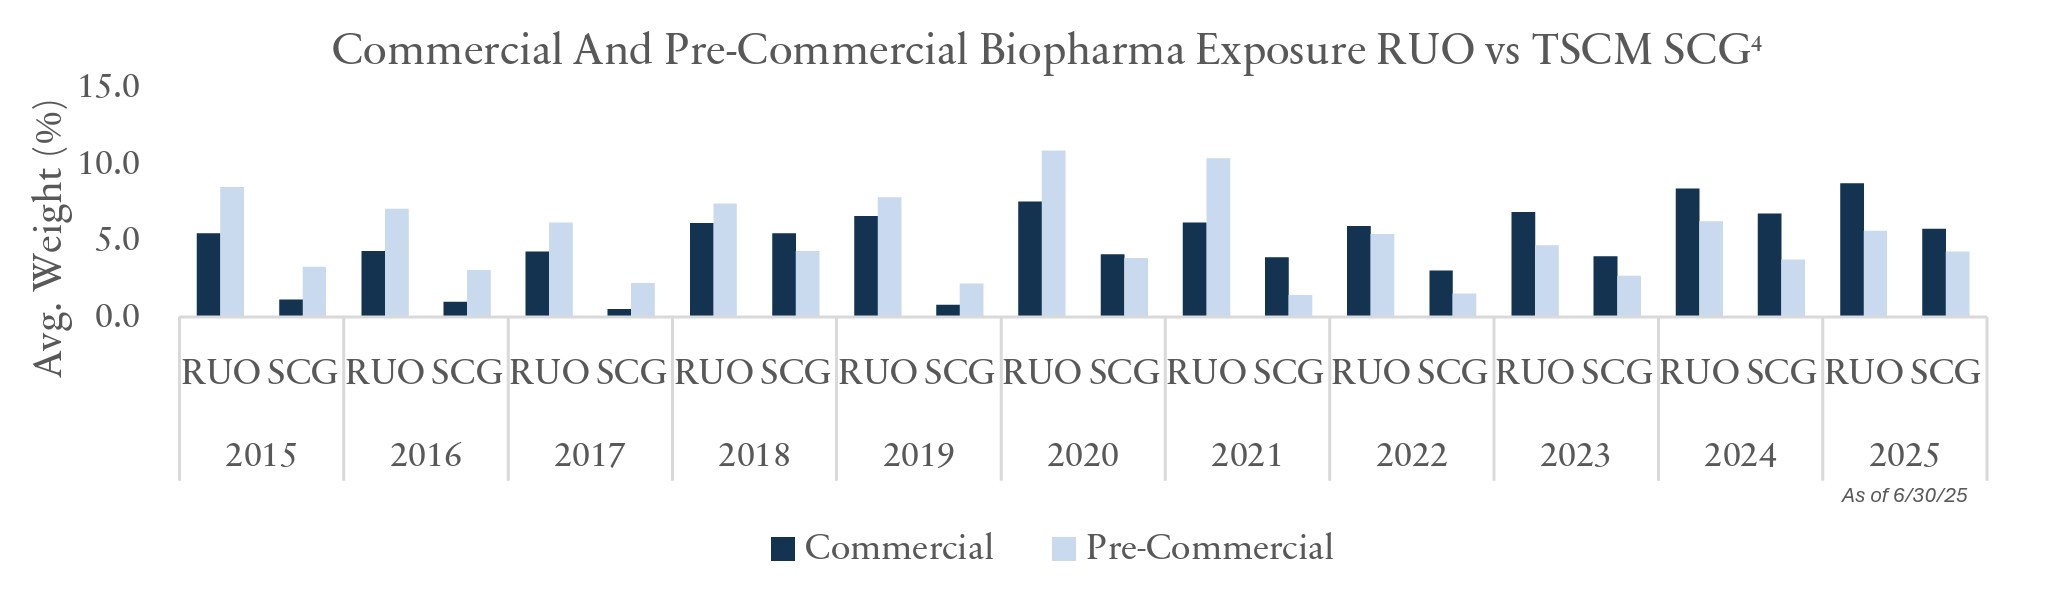
As quality growth managers we have maintained a consistent underweight to biopharma, due in part to our intentional avoidance of some of the more speculative early stage, pre-commercial biopharma companies that populate the index and possess significant levels of binary risk. Thus, we strategically tilt our portfolio weighting 3 to commercial companies and maintain a more pronounced underweight to pre-commercial biopharma (~-400bps) vs commercial biopharma (~-300bps).
We believe our strategic approach to biopharma investing has been successful, generating substantial alpha in a risk disciplined manner while maintaining significant underweight relative to the benchmark. From 2015 through June 2025, our biopharma positioning⁴ contributed 107 bps of annualized gross outperformance, while maintaining an average underweight of approximately 680 bps. We believe this performance demonstrates the effectiveness of our selective stock-picking approach, focusing on quality companies with strong fundamentals rather than simply matching benchmark weights or taking a basket approach. Additionally, our strategy 5 has benefited from persistent merger and acquisition activity within the sector, as approximately 15% of our unique biopharma investments have been acquired by larger companies, providing a meaningful tailwind to our returns. This M&A activity validates our ability to identify attractive takeover targets and underscores the value creation potential inherent in our carefully curated biopharma holdings, further contributing to consistent outperformance despite an underweight positioning.

This insight paper serves as just a glimpse into the longer-form and highly detailed Navigating Small Cap Biopharma white paper that we are pleased to provide upon request.
It’s worth reiterating that the way the benchmark is constructed, and growth and value are split, are based on definitions that haven’t changed in decades. As our team evaluates our holdings and seeks out new ideas, we have the freedom to cast a wider net across the landscape of companies, often finding those that don’t fit into the traditional growth or value boxes. These ideas are often overlooked by managers looking solely at the big index weights or the popular theme of the day.
One source of new ideas comes from a reexamination of companies undergoing potentially positive change(s) that the market is not fully appreciating (e.g. upgraded senior management, enhanced strategies/business models, improvements in their end markets). We believe we have the important advantage of sourcing ideas as they “graduate” from the dedicated Small Cap strategies we manage. These names are covered by the same investment team, so there is familiarity and institutional knowledge of these businesses when they have grown to the thresholds to be eligible for Mid Cap. When reviewing our Mid Cap Growth portfolio today, over 20% of current positions were previously held in our Small Cap strategy and are graduates of the selection process. Elevating these small cap names is one manner that refreshes our strategy and stays true to the essence of Mid Caps.
Passive investing in Russell Midcap index strategies increasingly means losing access to the true breadth and depth of companies across the Mid Cap market capitalization range. We argue that our active management and rigorous stock selection helps to provide a more authentic representation of Mid Cap exposure, allowing us to uncover attractive opportunities overlooked by the benchmark. As the index has become significantly larger and more concentrated, the need for this active approach is growing. Since these indexes are the default standard for Mid Cap allocations, their inherent structural risks are often disregarded; therefore, relying on the index alone for distinct Mid Cap exposure may prove insufficient. In other words, if you’re looking for exposure to the Mid Cap space and believe you’re getting it from allocating to the index, think again.
Strategy Performance

Updated Profiles & Commentaries Here
TimesSquare Recent Insights
Why International and Why Now
Looking Outward: Navigating global opportunities amid valuation gaps and evolving landscapes in Europe and Japan.
Emerging Markets, With or Without China
Investing Beyond Borders: Weighing China’s impact amid economic and geopolitical shifts.
Beyond the Headlines
Navigating Semiconductor Cycles: Uncover how end-market exposure shapes the evaluation of semiconductor companies in a dynamic industry.
The Importance of Quality
Defining Quality in Investing: Explore how TimesSquare integrates quality in our investment approach.
The Next Chapter: Japan’s Quality Growth Story Unfolds
Exploring Japan’s Investment Landscape: Dive into our latest insights on how market dynamics are reshaping investment opportunities in Japan.
Glossary
1 Source: Bloomberg, RUO, XBI. 2
2 Source: IQVIA Institute, Global Trends in R&D 2025, March 2025.
3 Source: TimesSquare Capital Management, LLC, as of 6/30/25.
4 Source: FactSet, RUO, TimesSquare Capital Management, LLC.
5 Source: TimesSquare Capital Management, LLC. The use of logos mentioned does not imply endorsement by the presenter.
Disclosures
TimesSquare Capital Management LLC is a growth equity specialist that is registered as an investment adviser with the U.S. Securities and Exchange Commission and is majority owned by Affiliated Managers Group, Inc. With an experienced investment team and rigorous fundamental analysis, we identify high quality companies with strong management in inefficient market cap ranges. As a boutique, our highly collaborative process and integrated approach promote our commitment to meeting our clients’ service needs. Importantly, employees share a common economic interest through equity participation aligning them with the success of our clients and the firm.
This material is for your private information and is provided for educational purposes only. The views expressed are the views of TimesSquare Capital Management, LLC only through the period ended June 2025 and are subject to change based on market and other conditions. The opinions expressed may differ from those with different investment philosophies. The information we provide does not constitute investment advice and it should not be relied on as such. It should not be considered an offer or solicitation to buy or an offer to sell a security. It does not consider any investor’s particular investment objectives, strategies, tax status or investment horizon. We encourage you to consult your tax or financial advisor. All material has been obtained from sources believed to be reliable, but its accuracy is not guaranteed. There is no representation or warranty as to the current accuracy of, nor liability for, decisions based on such information. Specific investments described herein do not represent all investment decisions made by TimesSquare. No assumption should be made that investment decisions identified and discussed were or will be profitable. Specific investment advice references provided herein are for illustrative purposes only and are not necessarily representative of investments that will be made in the future.
TimesSquare Capital Management, LLC claims compliance with the Global Investment Performance Standards (GIPS®) and is independently verified. A firm that claims compliance with the GIPS standards must establish policies and procedures for complying with all the applicable requirements of the GIPS standards. Verification provides assurance on whether the firm's policies and procedures related to composite and pooled fund maintenance, as well as the calculation, presentation, and distribution of performance, have been designed in compliance with the GIPS standards and have been implemented on a firm-wide basis. Policies for valuing investments, calculating performance, and preparing GIPS Reports are available upon request. GIPS® is a registered trademark of CFA Institute. CFA Institute does not endorse or promote this organization, nor does it warrant the accuracy or quality of the content contained herein.
Certain information contained herein has been obtained from third party sources and such information has not been independently verified by TSCM. No representation, warranty, or undertaking, expressed or implied, is given to the accuracy or completeness of such information by TSCM or any other person. While such sources are believed to be reliable, TimesSquare does not assume any responsibility for the accuracy or completeness of such information. It does not undertake any obligation to update the information contained herein as of any future date.
Any indices and other financial benchmarks shown are provided for illustrative purposes only, are unmanaged, reflect reinvestment of income and dividends and do not reflect the impact of advisory fees. Investors cannot invest directly in an index. Comparisons to indexes have limitations because indexes have volatility and other material characteristics that may differ from a particular hedge fund. For example, a hedge fund may typically hold substantially fewer securities than are contained in an index.
Certain information contained herein constitutes “forward-looking statements,” which can be identified by the use of forward-looking terminology such as “may,” “will,” “should,” “expect,” “anticipate,” “project,” “estimate,” “intend,” “continue,” or “believe,” or the negatives thereof or other variations thereon or comparable terminology. Due to various risks and uncertainties, actual events, results or actual performance may differ materially from those reflected or contemplated in such forward-looking statements. Nothing contained herein may be relied upon as a guarantee, promise, assurance or a representation as to the future.
U.S. Small Cap Growth: Performance is measured against the Russell 2000® Growth – a market capitalization-weighted index that measures the performance of those Russell 2000® companies with higher price-to-book ratios and higher forecasted growth rates. All indexes, including the Russell 2000® Growth Index, are based on gross-of-fee returns. FTSE Russell is the source and owner of the Russell Index data contained or reflected in this material and all trademarks and copyrights related thereto. Benchmark returns are not covered by the report of independent verifiers.
U.S. Small/Mid Cap Growth: Performance is measured against the Russell 2500 measures the performance of those Russell 2500 Growth – a market capitalization-weighted index that companies with higher price-to-book ratios and higher forecasted growth rates. All Growth Index, are based on gross-of-fee returns. FTSE Russell is the source and owner of the Russell indexes, including the Russell 2500 Index data contained or reflected in this material and all trademarks and copyrights related thereto. Benchmark returns are not covered by the report of independent verifiers.
U.S. Mid Cap Growth: Performance is measured against the Russell Midcap® Growth – a market capitalization-weighted index that measures the performance of those Russell Midcap® companies with higher price-to-book ratios and higher forecasted growth rates. All indexes, including the Russell Midcap® Growth Index, are based on gross-of-fee returns. FTSE Russell is the source and owner of the Russell Index data contained or reflected in this material and all trademarks and copyrights related thereto. Benchmark returns are not covered by the report of independent verifiers.
U.S. FOCUS Growth: Performance is measured against the Russell Midcap® Growth – a market capitalization-weighted index that measures the performance of those Russell Midcap® companies with higher price-to-book ratios and higher forecasted growth rates. All indexes, including the Russell Midcap® Growth Index, are based on gross-of-fee returns. FTSE Russell is the source and owner of the Russell Index data contained or reflected in this material and all trademarks and copyrights related thereto. Benchmark returns are not covered by the report of independent verifiers.
International Small Cap: Performance is measured against the MSCI EAFE Small Cap (Net) Index. MSCI EAFE Small Cap (Net) Index is a trade or service mark of MSCI Inc. The MSCI EAFE Small Cap (Net) Index is an unmanaged, market-weighted index of small companies in developed markets, excluding the U.S. and Canada. Its returns include net reinvested dividends but, unlike the Composite returns shown, do not reflect the payment of sales commissions or other expenses incurred in the purchase or sale of the securities included in the Index. All indexes, including the MSCI EAFE Small Cap (Net) Index, are based on gross-of-fee returns, including net reinvested dividends. Benchmark returns are not covered by the report of independent verifiers.
Global Small Cap: Performance is measured against the MSCI World Small Cap (Net) Index. MSCI World Small Cap (Net) Index is a trade or service mark of MSCI Inc. The MSCI World Small Cap (Net) Index is an unmanaged, market-weighted index of small companies in developed markets. Its returns include net reinvested dividends but, unlike the Composite returns shown, do not reflect the payment of sales commissions or other expenses incurred in the purchase or sale of the securities included in the Index. All indexes, including the MSCI World Small Cap (Net) Index, are based on gross-of-fee returns, including net reinvested dividends. Benchmark returns are not covered by the report of independent verifiers.
Past performance does not guarantee future results.
There is risk that invested capital may be lost. For more information, please contact us at info@tscmllc.com.
(Blue%20%26%20Gold)(Transparent)(2125x844)%20PNG.png)