
February 2025 Newsletter
TimesSquare reached a milestone anniversary celebrating its 20-year partnership with Affiliated Managers Group, Inc. (AMG) as an independent affiliate.
Firm Updates
TimesSquare reached a milestone anniversary celebrating its 20-year partnership with Affiliated Managers Group, Inc. (AMG) as an independent affiliate.
Personnel Updates
We thank Michael Russell, U.S. Research Analyst, for his incredible contributions to the firm over the last 19 years. Mike has had a wonderful 30-year career in the investment industry, and we wish him all the best in his next chapter. His retirement is effective March 31, 2025.
Notable Promotions over the past year
- John Metzner – Chief Technology Officer in March 2024 (21 years at TSCM)
- David Ferreiro – U.S. Small & SMID Portfolio Manager in May 2024 (10 years at TSCM)
- Mark Grzymski – U.S. Mid Cap Portfolio Manager in May 2024 (17 years at TSCM)
- Jackie Kepple – Chief Financial Officer in October 2024 (New to TSCM)
EM: With or Without China
Executive Summary
- Emerging Markets Small Cap continues to be perceived as a risky asset class.
- To date, the EM Small Cap index has demonstrated a comparable risk profile to the S&P 500 and the EAFE Small Cap indices.
- Emerging Markets as a whole (with or without China) offers significantly higher GDP growth than developed markets.
- For small cap companies, we see ambitious entrepreneurs and management teams creating great businesses, moving fast to capture opportunities, and becoming market leaders by using the latest technologies and lessons learned from analogous companies in other countries.
- The top-down view discussed is supported by our firsthand, bottom-up experience in these markets.
Market Overview (4Q 2024)
Entering 2024, expectations were that elections and central banks would dramatically affect prices and sentiment in global markets. Each did, especially in the fourth quarter.
- Government lending rates eased beginning with the European Central Bank (in the spring, with two more cuts in 4Q), followed by the Bank of England (in the summer with one cut in 4Q), and the U.S. (three times in 4Q).
- Elections dominated the news. In the U.S., the sweep by Trump’s Republican party created expectations for a pro-business, lower regulatory environment with protectionist tariffs.
- Across equity markets, the U.S. climbed sharply in November, offsetting weaker returns in October and December.
Analyst Updates
As our investment teams meet with companies, review recent earnings reports, and survey the global landscape, they note several investment dynamics that inform our positioning:
Consumer sentiment improved and spending was stable.
- Inflation seems to have bottomed out with some companies concerned about it accelerating.
- The threat of future tariffs led to higher near-term purchasing.
Among Industrials, we saw increased levels of new orders for manufacturers.
- Concerns about high prices and potential retaliatory tariffs from trading partners have weighed on some areas.
- A continued bright spot was the construction segment, either in advance of reshoring activities or plans to build more data centers.
Technology continues to be bolstered by an apparent insatiable appetite for all things AI.
- Global spending on related infrastructure benefited an ecosystem of semiconductors, capital equipment, construction, and power companies.
- Importantly, we began to see wider adoption and use cases for AI across a variety of industries including retail, advertising, and financial services.
A more accommodating regulatory environment should benefit the Financials sector and capital markets firms.
- If the new Federal Trade Commission shows greater deference when reviewing proposed mergers, it should further benefit the sector.
- At the other end of the spectrum, the IPO pipeline appears well populated for new public companies in 2025.
Uncertainty increased, however, across parts of the Health Care sector.
- New regulators have very mixed views on health care, and the market is concerned about the near term.
- Globally, the sector fell -11% within the MSCI World Index this quarter.
Emerging Markets: With or Without China
David Oh and Leona Yang, CFA
Over the last few years, a slowing economy and heightened geopolitical risk in China has increasingly led investors to consider dividing their EM allocations into China and ex-China strategies, and we are often asked for our view on removing or reducing China exposure within the Emerging Markets investment universe.
As fundamental stock pickers, we look for quality growth companies that meet our investment criteria. These companies should generate organic top-line growth significantly exceeding GDP growth and, with optimal business models, translate this into even stronger profit growth. When evaluating opportunities within the EM Small Cap universe, we also consider the larger regional or country-specific economic backdrop in which the company operates to enhance our understanding of the associated risks and opportunities. Our analysis includes historical and forecasted GDP growth ranges, as well as valuation, volatility, FX dynamics and other company and country specific factors.
In Figure 1, we summarized GDP growth data (recent and forecasted), country-level valuation and volatility, and benchmark weights for most of the major EM small cap countries, which helps frame our thought process in terms of short-term and longer-term returns and risks associated with these markets.
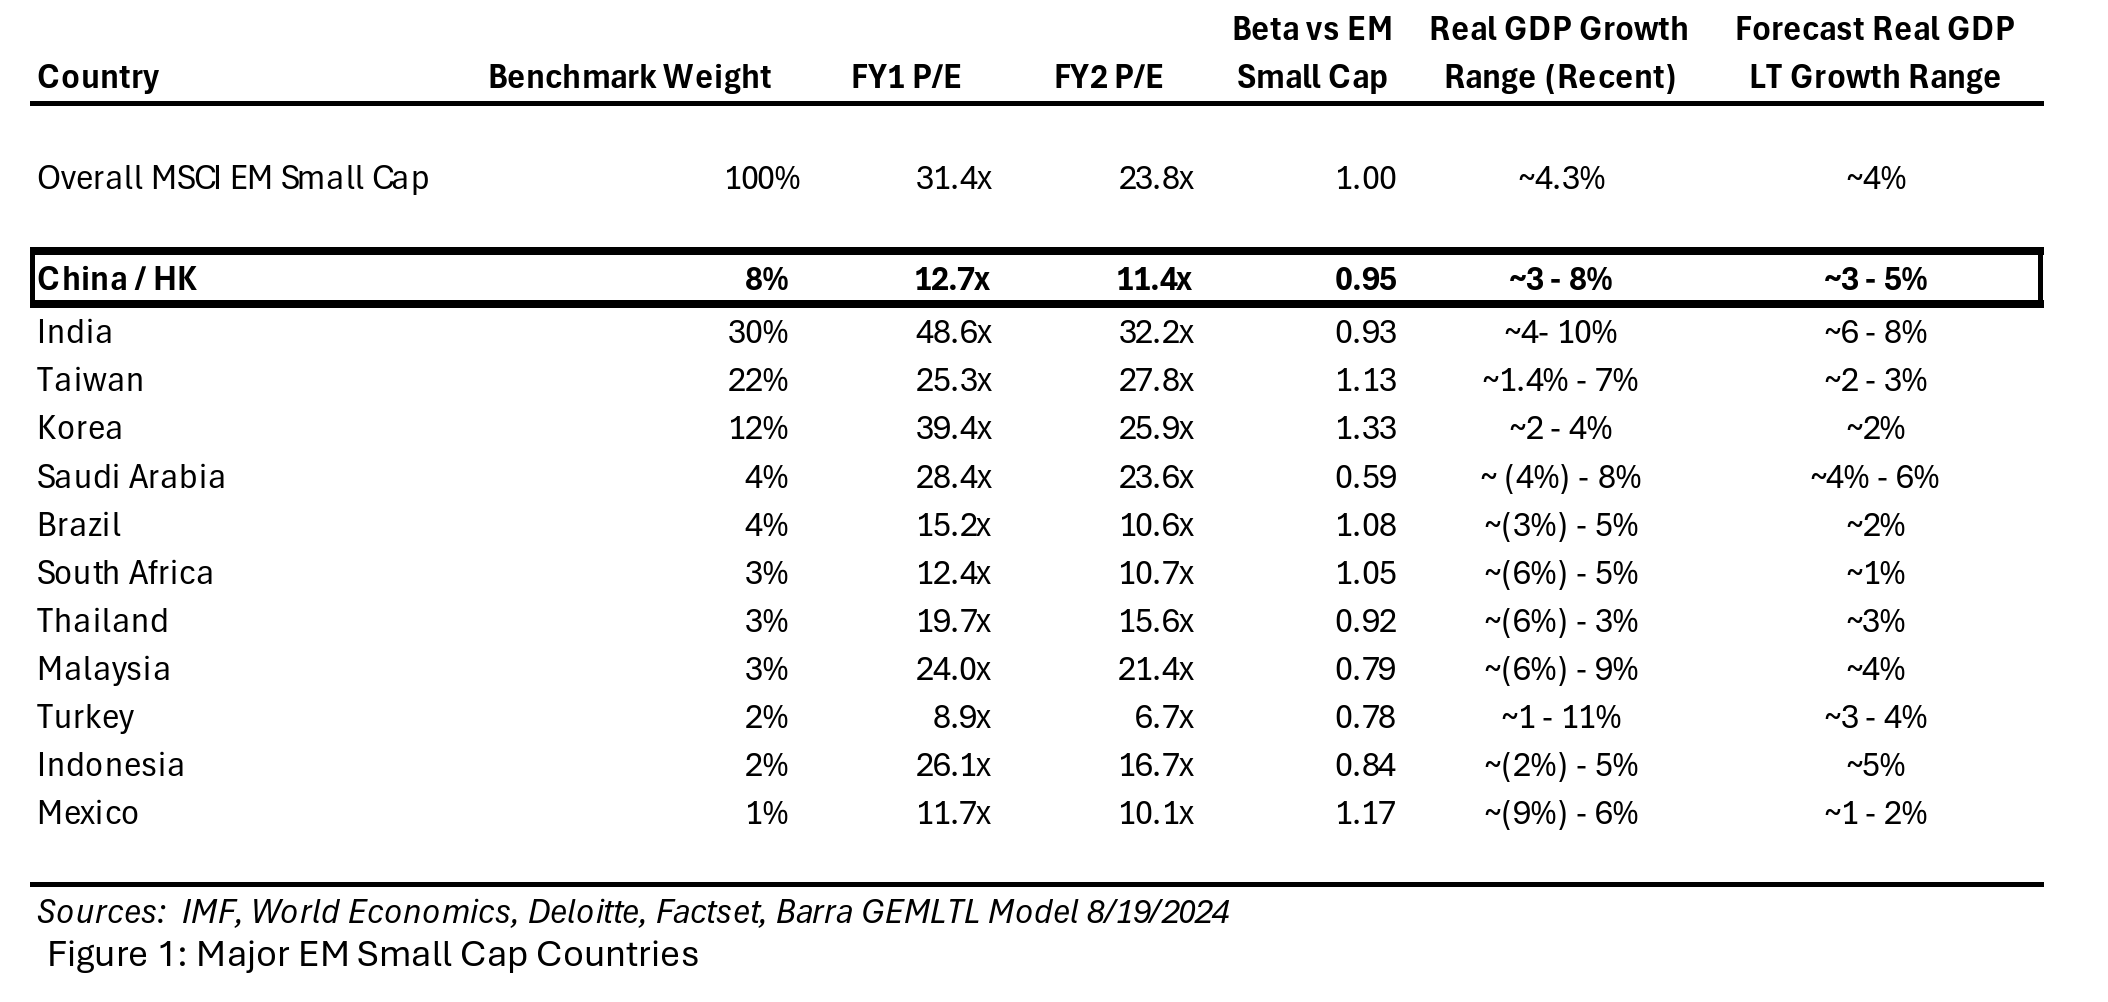
Our Outlook for China
GDP growth expectations are within the 3-5% range as the Chinese government prioritizes higher quality, more sustainable growth, even with its most recent stimulus measures. Against this backdrop, we expect the strongest growth to come from parts of the technology sector including software, healthcare (driven by localization policies and an aging population), and consumer-related sectors that benefit from both local brand strength and downtrading. Within these sectors, we typically target companies that can sustainably grow their top line by at least 1.5x to 2x GDP, with resulting earnings that should be in the low to mid double digits.
We see opportunities in Chinese companies that have the capabilities to expand abroad, where addressable markets offer higher growth as well as higher margins. These companies, having survived intense competition at home, have developed “lean and mean” capabilities to thrive internationally. In our meetings with Chinese and global companies, we have observed that many Chinese companies are already market leaders not just in China but also globally.
In the current environment, we do not assume significant longer term valuation multiple re-rating, which means our assumed returns are mostly linked to earnings growth and capital returns. There is also potential for downside depending on any further deterioration in US-China relations and capital outflows if investors continue to decrease allocations to China. However, we would note that valuations are quite reasonable, and expectations are low. In the event that economic growth and sentiment improve, there could be substantial upside to earnings growth forecasts and valuation multiples
Our Outlook for EM ex-China
We anticipate high benchmark weight markets such as India, the aggregated ASEAN (Association of Southeast Asian Nations), and Middle East contributing to strong GDP growth in the near and longer term. These markets benefit from factors driving past EM growth, such as expanding middle-class consumption, infrastructure investment, and supportive government policies. Additionally, they attract capital investment coming from either Chinese or multinational companies re-allocating investment away from China. We believe these trends will persist for the long-term, sustaining these higher GDP growth levels and creating a wealth of investment opportunities with substantial and durable top- and bottom-line growth potential.
For example, while valuations seem elevated in India, we have been able to find companies with strong growth prospects that result in more reasonable long-term valuations. The country’s pro-growth government and a supportive capital market bolstered by the increasing popularity of domestic retail-driven SIPs (systematic investment programs, which are similar to a 401k-style program) since 2017, have also contributed to a favorable investment environment.
Meanwhile, markets such as Taiwan and Korea have more muted GDP growth prospects. Yet, in certain sectors (such as those with companies benefiting from AI investment), we see an ability to achieve above average top and bottom-line growth in the near term. Additionally, Korea and Taiwan engage in high value trading with the entire world, including China and the US. However, we believe that Taiwan and Korea will revert to lower growth in the longer term due to the cyclicality of the IT hardware spending cycle and other export industries that they participate in.
Valuations and expectations for many of these larger benchmark weight markets are elevated, leading us to be more selective about companies from this universe. We would note that China presents a significant opportunity for companies in these other markets in various ways, allowing EM investors to benefit from China exposure even if they are not directly investing in Chinese equities. In any case, an understanding of China and the companies that are pushing into these other markets remains an essential part of any emerging markets strategy.
Emerging Markets Small Cap, with or without China
Finally, while Emerging Markets Small Cap has been perceived as a risky asset class, to date the EM Small Cap index has demonstrated a comparable risk profile to the S&P 500 and the EAFE Small Cap indices1.
Meanwhile, Emerging Markets as a whole (with or without China) offers significantly higher GDP growth than developed markets. According to the IMF, EM countries are projected to grow ~4% as compared to developed markets’ GDP growth of ~1.5%. This top-down view is supported by our firsthand experience in these markets, particularly for small cap companies, where we see ambitious entrepreneurs and management teams creating great businesses, moving fast to capture opportunities, and becoming market leaders by using the latest technologies and lessons learned from analogous companies in other countries.
Regardless of whether investors allocate to China or not, China cannot be ignored. The recent impact of DeepSeek highlights that China is home to engineering talent that is globally competitive and has moved up the value chain.
Small Caps
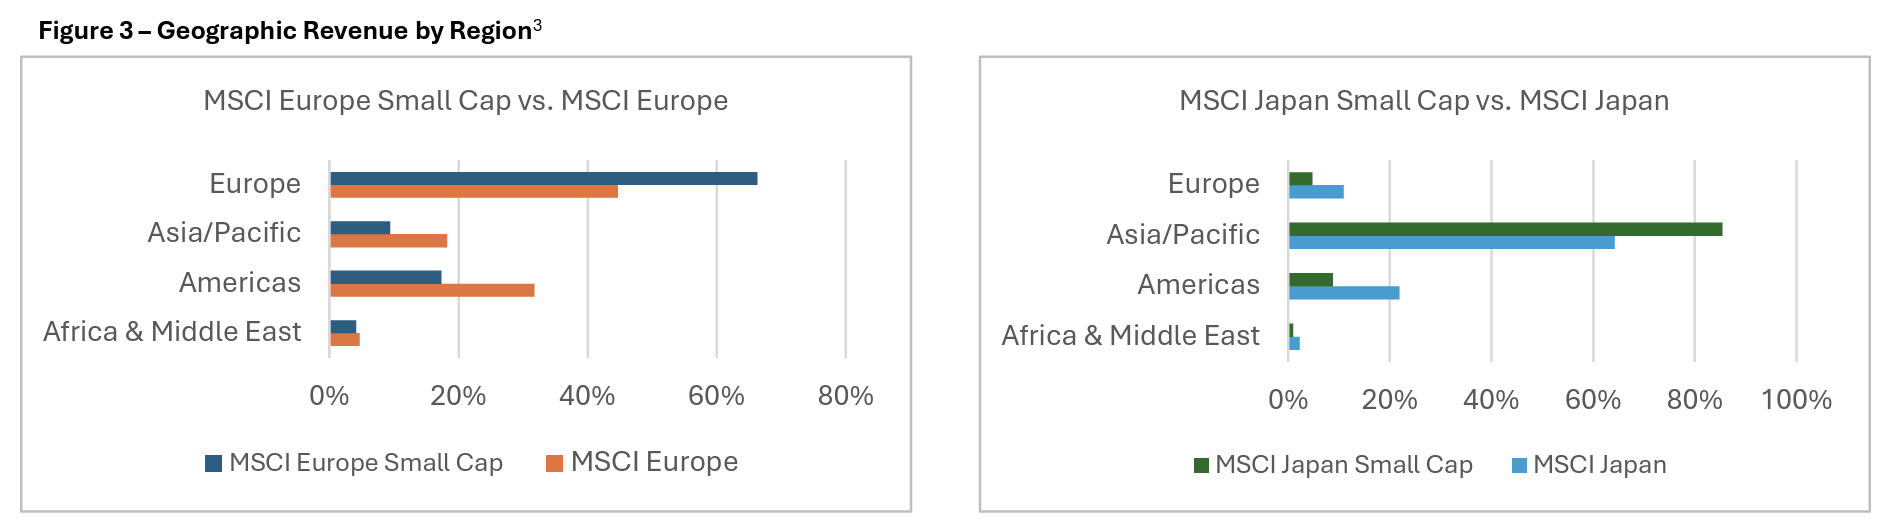
As illustrated in Figure 3, on average, smaller cap companies in Japan and Europe generate higher proportions of their revenues domestically. This ties them more directly to the local economic fundamentals and consumer behaviors. By allocating to small cap companies, investors have the opportunity to gain targeted exposure to local economies and potentially capture idiosyncratic growth opportunities that are less susceptible to global macroeconomic and geopolitical influences.
Why a Quality Growth approach matters?
Investment styles and asset classes may rise and fall in popularity during market cycles due to macroeconomic changes or investment sentiment. As bottom-up investors with a focus on business fundamentals, we seek high quality growth companies with a competitive edge - those with pricing power, strong management teams, and robust balance sheets. These companies, even during turbulent markets, tend to exhibit greater resilience and offer higher visibility in future growth. Given our preference for differentiated companies, we seek to have a positive exposure to profitability and growth highlighting an unwavering commitment to style consistency in our portfolio.
We believe the solidity of this approach will lead to better outcomes for our investors and do so in a risk-managed way.
Updated Profiles & Commentaries Here
TimesSquare Recent Insights
Beyond the Headlines
Navigating Semiconductor Cycles: Uncover how end-market exposure shapes the evaluation of semiconductor companies in a dynamic industry.
The Importance of Quality
Defining Quality in Investing: Explore how TimesSquare integrates quality in our investment approach.
The Next Chapter: Japan’s Quality Growth Story Unfolds
Exploring Japan’s Investment Landscape: Dive into our latest insights on how market dynamics are reshaping investment opportunities in Japan.
Growth is Where the Growth is
Unlocking the Power of Small Caps: Discover why TimesSquare prioritizes growth for long-term success.
1 Predicted volatility, Barra GEMLTL Model
Disclosures
TimesSquare Capital Management LLC is a growth equity specialist that is registered as an investment adviser with the U.S. Securities and Exchange Commission and is majority owned by Affiliated Managers Group, Inc. With an experienced investment team and rigorous fundamental analysis, we identify high quality companies with strong management in inefficient market cap ranges. As a boutique, our highly collaborative process and integrated approach promote our commitment to meeting our clients’ service needs. Importantly, employees share a common economic interest through equity participation aligning them with the success of our clients and the firm.
This material is for your private information and is provided for educational purposes only. The views expressed are the views of TimesSquare Capital Management, LLC only through the period ended June 2025 and are subject to change based on market and other conditions. The opinions expressed may differ from those with different investment philosophies. The information we provide does not constitute investment advice and it should not be relied on as such. It should not be considered an offer or solicitation to buy or an offer to sell a security. It does not consider any investor’s particular investment objectives, strategies, tax status or investment horizon. We encourage you to consult your tax or financial advisor. All material has been obtained from sources believed to be reliable, but its accuracy is not guaranteed. There is no representation or warranty as to the current accuracy of, nor liability for, decisions based on such information. Specific investments described herein do not represent all investment decisions made by TimesSquare. No assumption should be made that investment decisions identified and discussed were or will be profitable. Specific investment advice references provided herein are for illustrative purposes only and are not necessarily representative of investments that will be made in the future.
TimesSquare Capital Management, LLC claims compliance with the Global Investment Performance Standards (GIPS®) and is independently verified. A firm that claims compliance with the GIPS standards must establish policies and procedures for complying with all the applicable requirements of the GIPS standards. Verification provides assurance on whether the firm's policies and procedures related to composite and pooled fund maintenance, as well as the calculation, presentation, and distribution of performance, have been designed in compliance with the GIPS standards and have been implemented on a firm-wide basis. Policies for valuing investments, calculating performance, and preparing GIPS Reports are available upon request. GIPS® is a registered trademark of CFA Institute. CFA Institute does not endorse or promote this organization, nor does it warrant the accuracy or quality of the content contained herein.
Certain information contained herein has been obtained from third party sources and such information has not been independently verified by TSCM. No representation, warranty, or undertaking, expressed or implied, is given to the accuracy or completeness of such information by TSCM or any other person. While such sources are believed to be reliable, TimesSquare does not assume any responsibility for the accuracy or completeness of such information. It does not undertake any obligation to update the information contained herein as of any future date.
Any indices and other financial benchmarks shown are provided for illustrative purposes only, are unmanaged, reflect reinvestment of income and dividends and do not reflect the impact of advisory fees. Investors cannot invest directly in an index. Comparisons to indexes have limitations because indexes have volatility and other material characteristics that may differ from a particular hedge fund. For example, a hedge fund may typically hold substantially fewer securities than are contained in an index.
Certain information contained herein constitutes “forward-looking statements,” which can be identified by the use of forward-looking terminology such as “may,” “will,” “should,” “expect,” “anticipate,” “project,” “estimate,” “intend,” “continue,” or “believe,” or the negatives thereof or other variations thereon or comparable terminology. Due to various risks and uncertainties, actual events, results or actual performance may differ materially from those reflected or contemplated in such forward-looking statements. Nothing contained herein may be relied upon as a guarantee, promise, assurance or a representation as to the future.
U.S. Small Cap Growth: Performance is measured against the Russell 2000® Growth – a market capitalization-weighted index that measures the performance of those Russell 2000® companies with higher price-to-book ratios and higher forecasted growth rates. All indexes, including the Russell 2000® Growth Index, are based on gross-of-fee returns. FTSE Russell is the source and owner of the Russell Index data contained or reflected in this material and all trademarks and copyrights related thereto. Benchmark returns are not covered by the report of independent verifiers.
U.S. Small/Mid Cap Growth: Performance is measured against the Russell 2500 measures the performance of those Russell 2500 Growth – a market capitalization-weighted index that companies with higher price-to-book ratios and higher forecasted growth rates. All Growth Index, are based on gross-of-fee returns. FTSE Russell is the source and owner of the Russell indexes, including the Russell 2500 Index data contained or reflected in this material and all trademarks and copyrights related thereto. Benchmark returns are not covered by the report of independent verifiers.
U.S. Mid Cap Growth: Performance is measured against the Russell Midcap® Growth – a market capitalization-weighted index that measures the performance of those Russell Midcap® companies with higher price-to-book ratios and higher forecasted growth rates. All indexes, including the Russell Midcap® Growth Index, are based on gross-of-fee returns. FTSE Russell is the source and owner of the Russell Index data contained or reflected in this material and all trademarks and copyrights related thereto. Benchmark returns are not covered by the report of independent verifiers.
U.S. FOCUS Growth: Performance is measured against the Russell Midcap® Growth – a market capitalization-weighted index that measures the performance of those Russell Midcap® companies with higher price-to-book ratios and higher forecasted growth rates. All indexes, including the Russell Midcap® Growth Index, are based on gross-of-fee returns. FTSE Russell is the source and owner of the Russell Index data contained or reflected in this material and all trademarks and copyrights related thereto. Benchmark returns are not covered by the report of independent verifiers.
International Small Cap: Performance is measured against the MSCI EAFE Small Cap (Net) Index. MSCI EAFE Small Cap (Net) Index is a trade or service mark of MSCI Inc. The MSCI EAFE Small Cap (Net) Index is an unmanaged, market-weighted index of small companies in developed markets, excluding the U.S. and Canada. Its returns include net reinvested dividends but, unlike the Composite returns shown, do not reflect the payment of sales commissions or other expenses incurred in the purchase or sale of the securities included in the Index. All indexes, including the MSCI EAFE Small Cap (Net) Index, are based on gross-of-fee returns, including net reinvested dividends. Benchmark returns are not covered by the report of independent verifiers.
Global Small Cap: Performance is measured against the MSCI World Small Cap (Net) Index. MSCI World Small Cap (Net) Index is a trade or service mark of MSCI Inc. The MSCI World Small Cap (Net) Index is an unmanaged, market-weighted index of small companies in developed markets. Its returns include net reinvested dividends but, unlike the Composite returns shown, do not reflect the payment of sales commissions or other expenses incurred in the purchase or sale of the securities included in the Index. All indexes, including the MSCI World Small Cap (Net) Index, are based on gross-of-fee returns, including net reinvested dividends. Benchmark returns are not covered by the report of independent verifiers.
Past performance does not guarantee future results.
There is risk that invested capital may be lost. For more information, please contact us at info@tscmllc.com.
(Blue%20%26%20Gold)(Transparent)(2125x844)%20PNG.png)