
November 2025 Newsletter
During the fourth quarter of 2025, TimesSquare proudly celebrated 25 years of Quality Growth Investing. Throughout this time, we have stayed committed to our core investment philosophy while continuously learning, improving, and evolving as a firm.
Firm Updates
Congratulations to our colleagues on their well-deserved promotions and new hires welcomed this year. We are also excited to add further breadth to the Research team with active searches for Associate roles included below.
Promotions
- Edward Salib: Portfolio Manager - U.S. Mid Cap Growth & FOCUS Growth (23 years at TSCM)
- Gregory Vasse: Portfolio Manager – U.S. Small & SMID Cap Growth and Global Small Cap (17 years at TSCM)
- Jacob Troutman: U.S. Research Analyst – Business & Information Services and Energy (12 years at TSCM)
- Margot Waldron: U.S. Research Analyst – Health Care (4 years at TSCM)
New Hires
- Adam Krasner: U.S. Research Analyst – Financial Services
- Ryan Williams: U.S. Research Associate – Industrials & Consumer
- Christopher LaRegina: Director of Digital Marketing
Open Positions
- U.S. Research Associate – Information Technology
- U.S. Research Associate – Health Care
2025 Annual Portfolio Manager Letters
Executive Summary
Mid Cap companies continue to offer a compelling blend of stability and growth, despite the Russell Mid Cap Growth Index increasingly drifting from its traditional definition. Rising concentration, a shrinking number of constituents, and sharp sector shifts driven by mechanical rebalancing have made passive exposure less representative of the true Mid Cap landscape. An active, research-driven approach can help restore alignment with the segment’s fundamentals. By emphasizing differentiated, scalable businesses with strong management teams, pricing power, and disciplined capital allocation, active managers can identify opportunities that index-driven strategies often overlook— particularly as companies evolve, strengthen their competitive positions, or graduate from the small-cap universe. As the Mid Cap index continues to evolve, we at TimesSquare remain committed to offering clients a reliable, research-driven path to capturing the long-term potential of this vital segment of the market.
Research Analyst Deep Dive – Information Technology
This quarter, we focus our perspective on the Information Technology sector and the drivers behind why it remains fundamentally robust and how the dynamics of value creation are changing.

“We believe the Mid Cap Strategy is well positioned for the next cycle, one likely to be defined by dispersion, separating companies that merely participate in the AI build from those successfully monetizing AI deployment.”
Sector Outlook
The market is pivoting from rewarding speculative growth to demanding profitable scaling and tangible return on investment (ROI) from massive infrastructure investments. We believe the next cycle will be defined by dispersion, separating companies that merely participate in the AI build from those that successfully monetize the AI delivery. Below is a breakdown of the key factors influencing the sector's trajectory.
- Artificial Intelligence (AI): AI remains the primary engine of growth, but the narrative is evolving from Training (building models) to Inference (running them) and Application (using them). Hyperscalers (Microsoft, Google, Amazon, Meta, Oracle), AI-native companies (OpenAI, Anthropic) and sovereign nations are locked in an arms race, pouring hundreds of billions into data centers. This is creating a "new super cycle of capex spend" that benefits hardware and infrastructure companies. While this benefits the hardware giants, the derivative opportunity lies in the mid-cap suppliers providing the "picks and shovels” such as power management, electrical and mechanical services which are essential to keep these massive clusters running. Finally, the rise of Agentic AI validates a massive shift in monetization. We are moving away from selling tools that people use, toward selling outcomes that software delivers. This breaks the correlation between revenue growth and headcount, allowing software companies to capture the massive budget previously allocated to human labor wages, not just IT budgets.
- Cybersecurity: In an era of AI-accelerated attacks (AI-generated code, sophisticated deep-fake phishing), cybersecurity remains a top boardroom mandate. Enterprises are grappling with a persistent threat landscape while simultaneously managing dozens of security vendors. This is driving a push toward Platformization. Companies that offer unified security across the Cloud, Endpoint, and Identity—simplifying the stack and improving automation—are designed to win significant market share. Spending on security and risk management is projected to see double-digit growth, driven by the persistent threat landscape, ongoing cloud migration, and ever-increasing regulatory compliance requirements.
- Cloud Computing: The cloud remains a foundational growth area, but its value proposition is now inextricably linked to AI. The migration to the cloud is re-accelerating because enterprises realize they cannot deploy AI on fragmented, onpremise data. The re-acceleration of cloud migration is now driven by the necessity of Data Modernization. AI models are only effective with clean, organized data, forcing companies to move their fragmented legacy data into agile, cloudnative formats.
- The Semiconductor Industry: Semiconductors are the building blocks of the digital economy. Demand for AI GPUs remains insatiable, but hyperscalers (like Amazon, Google, and Microsoft) are also increasingly designing their own custom silicon (ASICs) for internal inference work. Beyond the data center, cyclical markets (automotive/industrial) are bottoming out as inventory gluts clear, setting the stage for a broader recovery.
The Mid Cap Advantage: How Active Management Can Augment the Market’s Most Consistent Growth Engine
Edward Salib and Sonu Chawla, CFA
As long-time U.S. public equity investors we view mid capitalization companies as an attractive balance between large caps and small caps. These companies have matured into a growth phase that is often more stable than when they were small caps, though with higher incremental growth than large caps. The return and risk data over the last 25 years bears that out:

In addition, when reviewing five-year monthly rolling performance over that same 25-year period:
- Mid outperformed large 57% of the time (by an average of 373 basis points)
- Mid outperformed small 92% of the time (by an average of 199 basis points)
Are the Mid Cap Goal Posts Moving?
By FTSE Russell’s definition, the widely used Russell Midcap Index always begins with 800 stocks and allows for proportionate weighting of those names into the Growth⁴ and Value⁵ indexes. Typically, both Growth and Value have over 400 names each. However, with the more recent trend of market cap expansion / capital moving into Growth stocks, the dynamics for the Russell Midcap Growth, Value, and overall Index have changed.
Fewer, Larger Growth Names Dominate the Indexes
Because FTSE Russell balances the capital between growth and value, fewer names are needed to populate the Growth Index. As the Russell Midcap Growth Index has become more top heavy, it now includes fewer stocks than ever. The index has fewer than 300 companies (281 to be exact) for the first time on record, down from a high of 552 in 2015 and 408 just three years ago. Furthermore, this has resulted in greater concentration and total weight in the Russell Midcap Growth’s top ten. Ten years ago, the top ten weight was under 10%, 15% in 2024, and now 21.5% as of September 2025.
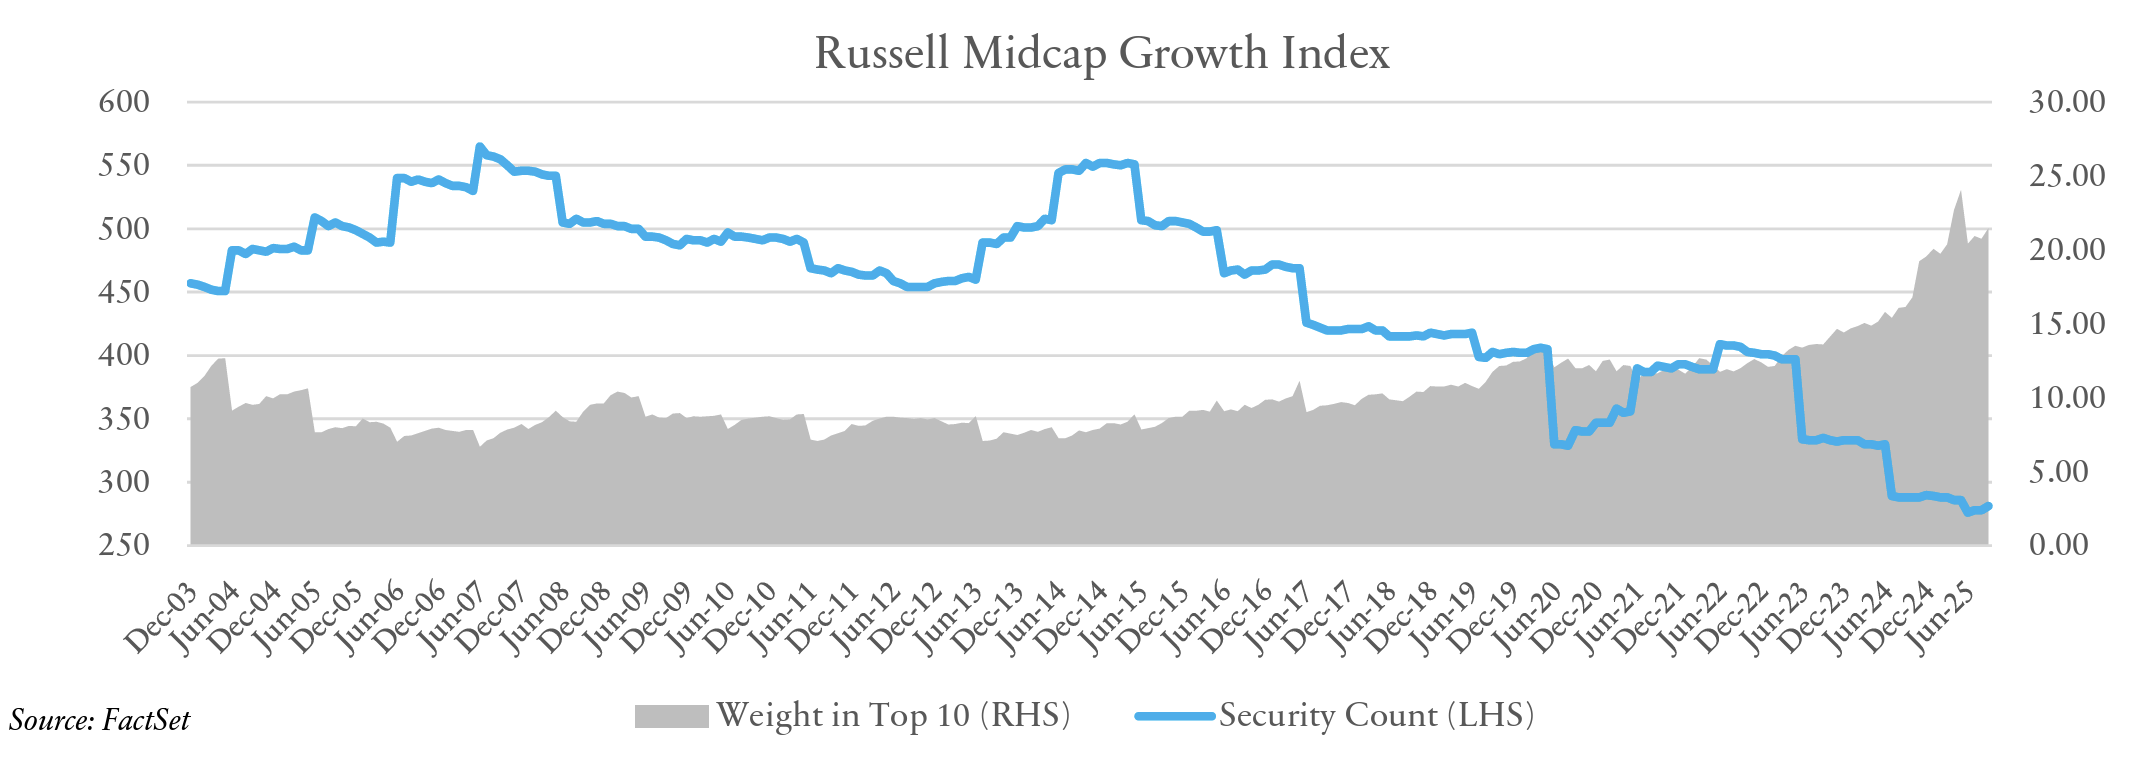
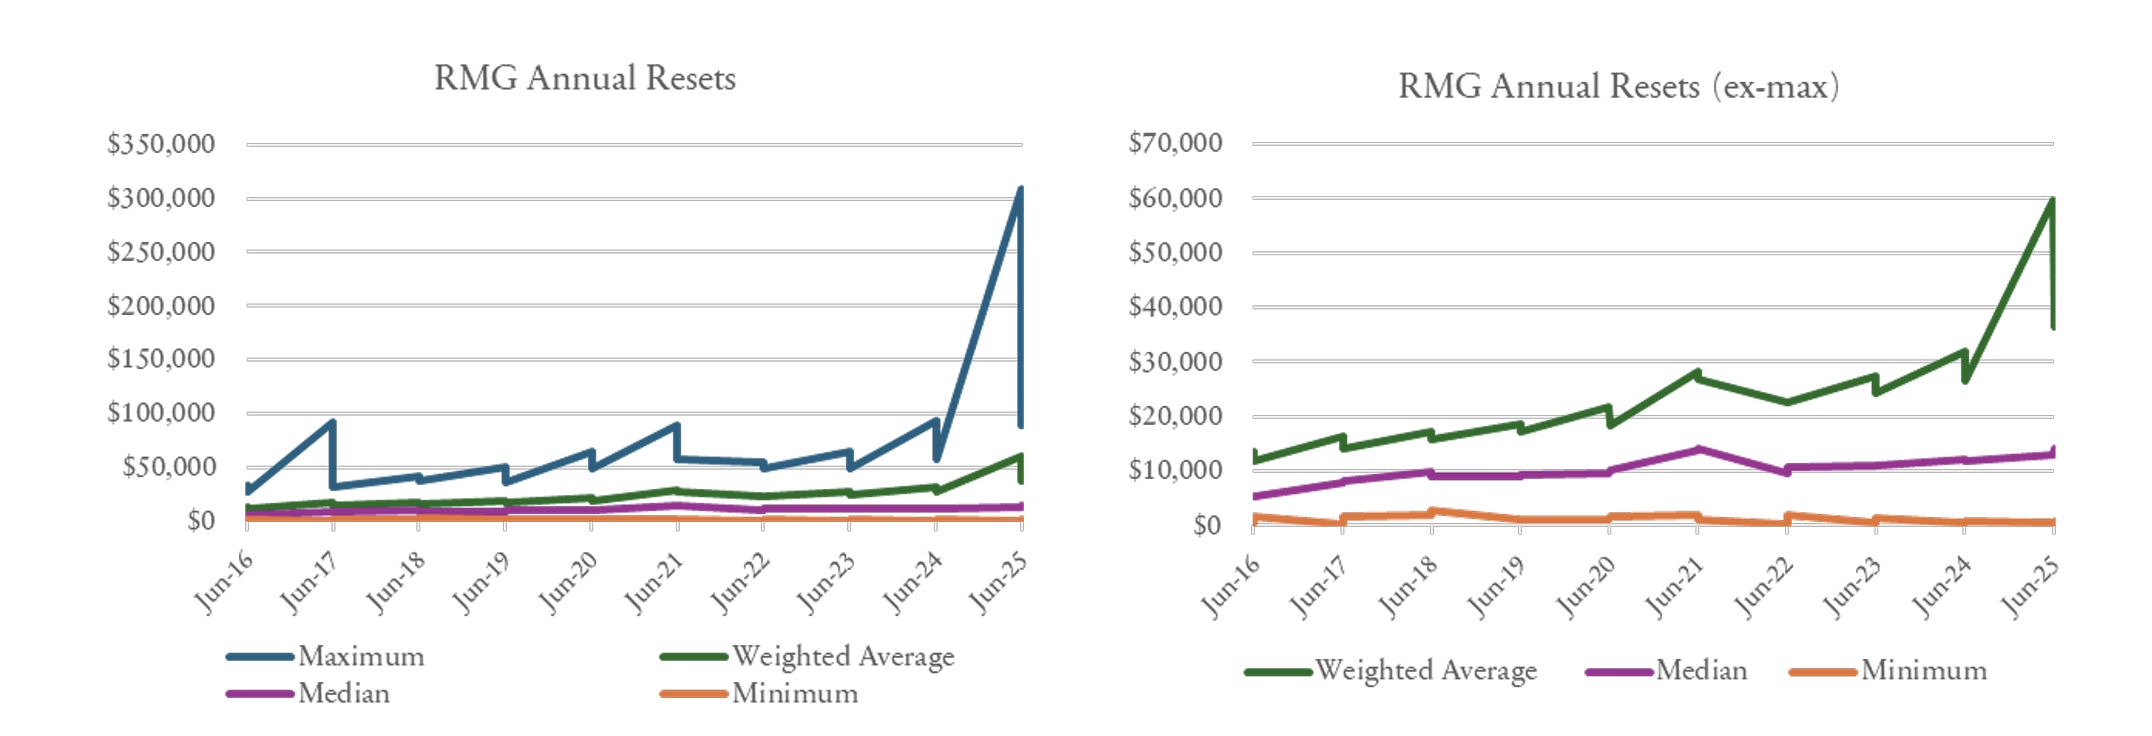
While FTSE Russell reconstitutes its indexes annually (and beginning in 2026, semiannually), in part to “graduate” the larger cap constituents to Russell’s mega cap Top 200 Index⁶, there has been a steady upward trend of the size profile for the Russell Midcap Growth Index:
Sector Exposures are Subject to Rapid Moves
The same mechanistic nature of the index creation and rebalancing that causes those concentration levels also affects the economic sector exposures within the index. Shifts in the index during a rebalance can be dramatic and do not necessarily reflect economic realities or investment opportunities. Take the most recent rebalance in June 2025. Over 1,000 basis points abandoned the Information Technology sector and more than 800 basis points flooded into Consumer Discretionary. It’s not as if the economic landscape or opportunity set changed, but the structure of the index became dramatically different. Russell intends to reconstitute the indexes twice per year beginning in 2026 (once in June and again in November). In our view, this should mitigate some of the magnitude of these significant shifts, but it likely is not the trend.
In summary, the Russell Midcap Growth Index is increasingly concentrated, leading to material shifts in economic exposure, and appears to be drifting away from the historical market cap definition of Mid Cap. This steady increase in size and concentration is likely to continue unabated, which fundamentally changes the essence of Mid Cap when only using the indexes. As a small to mid-cap manager for over 25 years, we believe in offering our clients the exposures they are seeking, and style purity is paramount to maintaining the integrity of our strategy.
The TimesSquare Difference
Being an active manager focused on quality growth businesses, we strive to avoid the hype that attracts capital over short time periods to the biggest index holdings, momentum darlings, or hyper growth names. Passive strategies will blindly mirror these trends. The bigger a name or sector gets in the index, the more capital chases which results in managers benchmark hugging / closet indexing. In contrast, TimesSquare’s fundamental research process involves a thorough bottom-up analysis of companies and how they create economic growth.
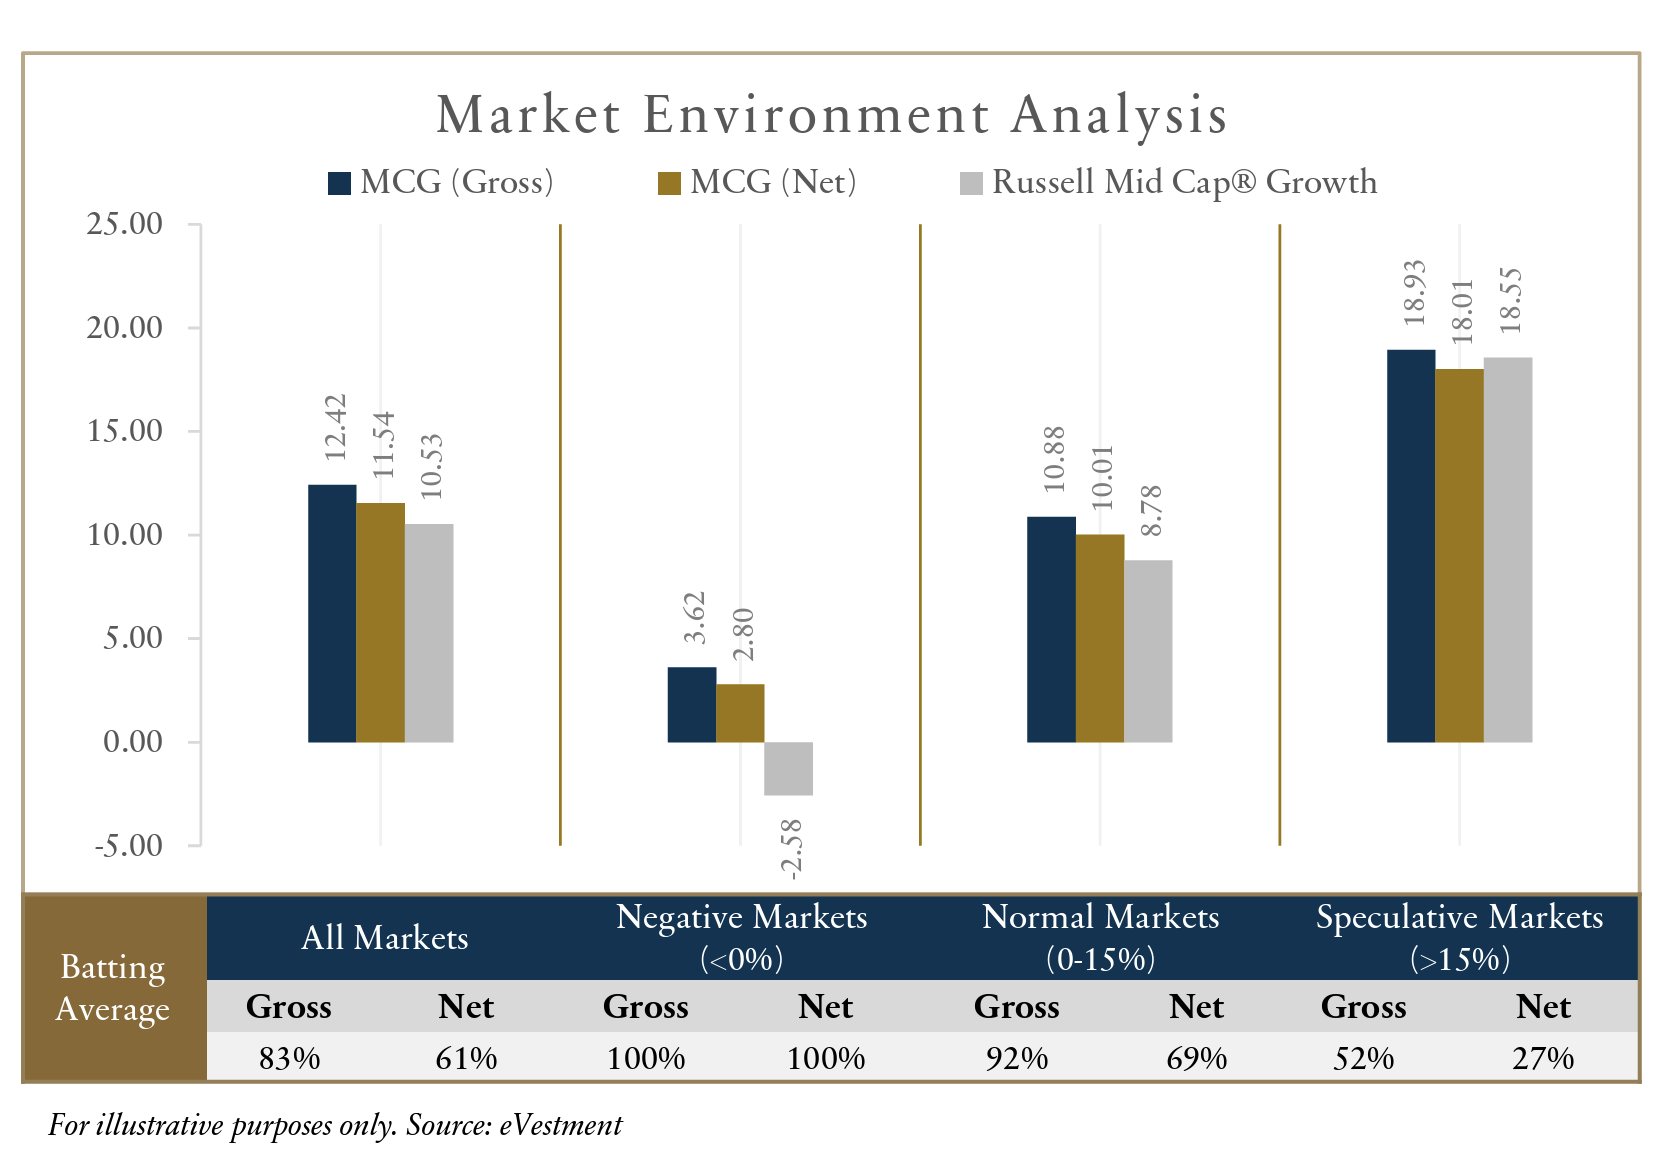
Our portfolios are not constructed top down by sector or industry. We take a clean slate approach to building positions and evaluating/revaluating the companies based solely on their merits. We favor differentiated, scaling businesses that are gaining share, demonstrating pricing power, and most importantly, deploying investor capital with a focus on generating returns. Our strategy primarily focuses on secular growth and long-term trends, while some are more cyclically positioned. Overall, we believe our 25-year track record demonstrates a consistent quality bias that endures through varying economic cycles. Since inception, our team has remained disciplined in executing this strategy and pursuing quality growth businesses, as illustrated in the market environment analysis below.
It’s worth reiterating that the way the benchmark is constructed, and growth and value are split, are based on definitions that haven’t changed in decades. As our team evaluates our holdings and seeks out new ideas, we have the freedom to cast a wider net across the landscape of companies, often finding those that don’t fit into the traditional growth or value boxes. These ideas are often overlooked by managers looking solely at the big index weights or the popular theme of the day.
One source of new ideas comes from a reexamination of companies undergoing potentially positive change(s) that the market is not fully appreciating (e.g. upgraded senior management, enhanced strategies/business models, improvements in their end markets). We believe we have the important advantage of sourcing ideas as they “graduate” from the dedicated Small Cap strategies we manage. These names are covered by the same investment team, so there is familiarity and institutional knowledge of these businesses when they have grown to the thresholds to be eligible for Mid Cap. When reviewing our Mid Cap Growth portfolio today, over 20% of current positions were previously held in our Small Cap strategy and are graduates of the selection process. Elevating these small cap names is one manner that refreshes our strategy and stays true to the essence of Mid Caps.
Passive investing in Russell Midcap index strategies increasingly means losing access to the true breadth and depth of companies across the Mid Cap market capitalization range. We argue that our active management and rigorous stock selection helps to provide a more authentic representation of Mid Cap exposure, allowing us to uncover attractive opportunities overlooked by the benchmark. As the index has become significantly larger and more concentrated, the need for this active approach is growing. Since these indexes are the default standard for Mid Cap allocations, their inherent structural risks are often disregarded; therefore, relying on the index alone for distinct Mid Cap exposure may prove insufficient. In other words, if you’re looking for exposure to the Mid Cap space and believe you’re getting it from allocating to the index, think again.
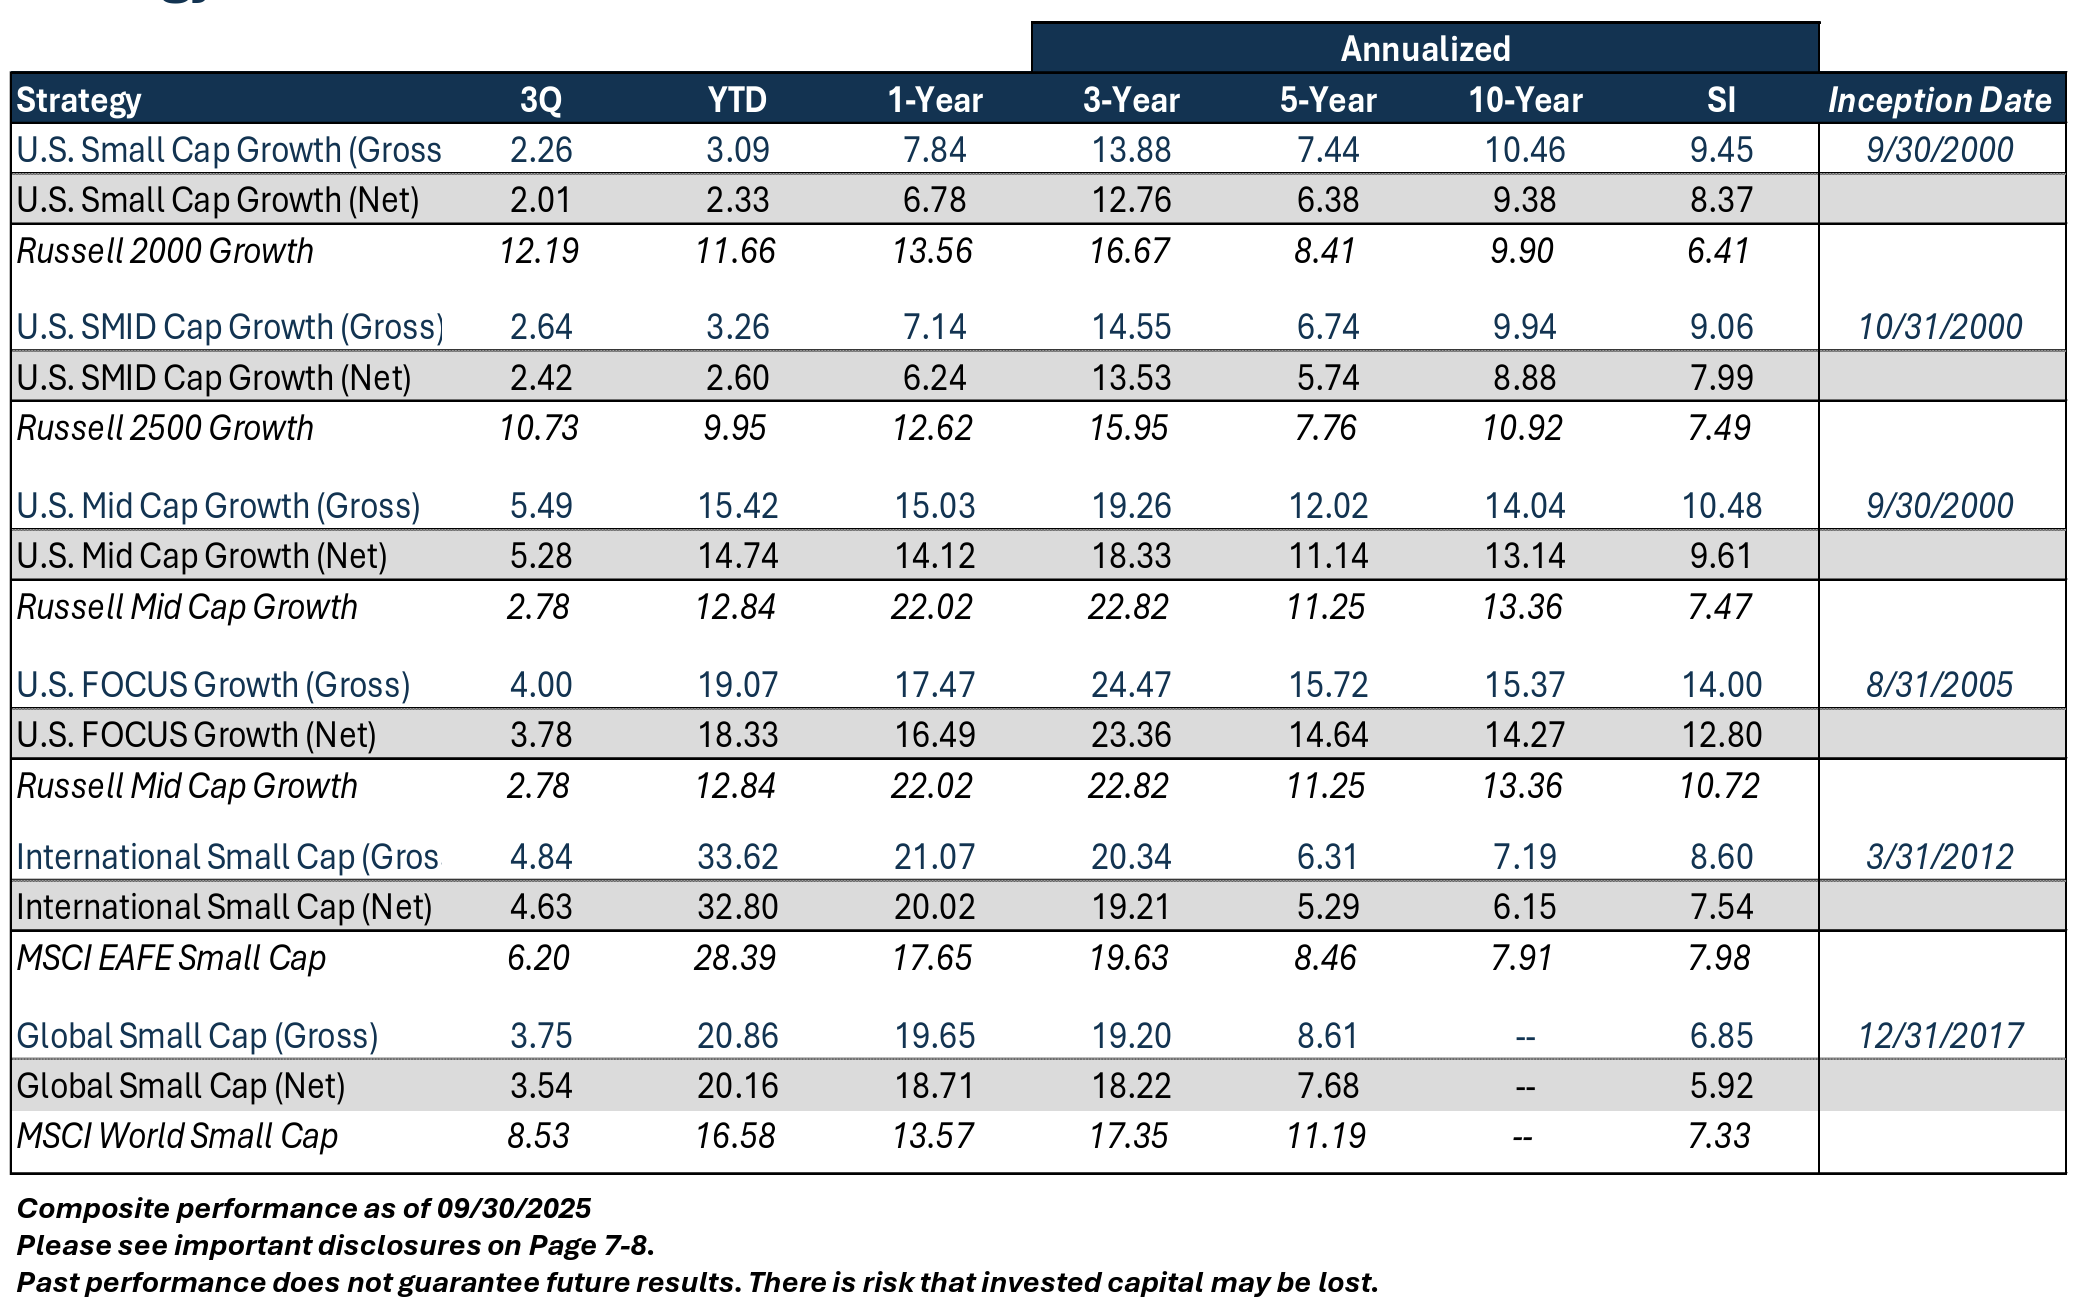
Strategy Performance
Updated Profiles & Commentaries Here
TimesSquare News & Insights
Navigating Small Cap Biopharma
Science Meets Strategy: Navigating innovation and growth opportunities in small cap biopharma amid complexity, volatility, and transformative scientific advancement.
Why International and Why Now
Looking Outward: Navigating global opportunities amid valuation gaps and evolving landscapes in Europe and Japan.
Emerging Markets, With or Without China
Investing Beyond Borders: Weighing China’s impact amid economic and geopolitical shifts.
Beyond the Headlines
Navigating Semiconductor Cycles: Uncover how end-market exposure shapes the evaluation of semiconductor companies in a dynamic industry.
The Importance of Quality
Defining Quality in Investing: Explore how TimesSquare integrates quality in our investment approach.
Glossary
¹ The Russell 1000® Index measures the performance of the large-cap segment of the US equity universe. The Russell 1000 Index is a subset of the Russell 3000® Index which is designed to represent approximately 98% of the investable US equity market.
² The Russell Midcap® Index measures the performance of the mid-cap segment of the US equity universe. The Russell Midcap Index is a subset of the Russell 1000® Index.
³ The Russell 2000® Index measures the performance of the small-cap segment of the US equity universe. The Russell 2000 Index is a subset of the Russell 3000® Index which is designed to represent approximately 98% of the investable US equity market.
⁴ The Russell Midcap® Growth Index measures the performance of the midcap growth segment of the US equity universe. It includes those Russell Midcap Index companies with relatively higher price-to-book ratios, higher I/B/E/S forecast medium term (2 year) growth and higher sales per share historical growth (5 years).
⁵ The Russell Midcap® Value Index measures the performance of the midcap value segment of the US equity universe. It includes those Russell Midcap Index companies with relatively lower price-to-book ratios, lower I/B/E/S forecast medium term (2 year) growth and lower sales per share historical growth (5 years).
⁶ The Russell Top 200® Index measures the performance of the largest cap segment of the US equity universe. The Russell Top 200 Index is a subset of the Russell 3000® Index.
Disclosures
TimesSquare Capital Management LLC is a growth equity specialist that is registered as an investment adviser with the U.S. Securities and Exchange Commission and is majority owned by Affiliated Managers Group, Inc. With an experienced investment team and rigorous fundamental analysis, we identify high quality companies with strong management in inefficient market cap ranges. As a boutique, our highly collaborative process and integrated approach promote our commitment to meeting our clients’ service needs. Importantly, employees share a common economic interest through equity participation aligning them with the success of our clients and the firm.
This material is for your private information and is provided for educational purposes only. The views expressed are the views of TimesSquare Capital Management, LLC only through the period ended June 2025 and are subject to change based on market and other conditions. The opinions expressed may differ from those with different investment philosophies. The information we provide does not constitute investment advice and it should not be relied on as such. It should not be considered an offer or solicitation to buy or an offer to sell a security. It does not consider any investor’s particular investment objectives, strategies, tax status or investment horizon. We encourage you to consult your tax or financial advisor. All material has been obtained from sources believed to be reliable, but its accuracy is not guaranteed. There is no representation or warranty as to the current accuracy of, nor liability for, decisions based on such information. Specific investments described herein do not represent all investment decisions made by TimesSquare. No assumption should be made that investment decisions identified and discussed were or will be profitable. Specific investment advice references provided herein are for illustrative purposes only and are not necessarily representative of investments that will be made in the future.
TimesSquare Capital Management, LLC claims compliance with the Global Investment Performance Standards (GIPS®) and is independently verified. A firm that claims compliance with the GIPS standards must establish policies and procedures for complying with all the applicable requirements of the GIPS standards. Verification provides assurance on whether the firm's policies and procedures related to composite and pooled fund maintenance, as well as the calculation, presentation, and distribution of performance, have been designed in compliance with the GIPS standards and have been implemented on a firm-wide basis. Policies for valuing investments, calculating performance, and preparing GIPS Reports are available upon request. GIPS® is a registered trademark of CFA Institute. CFA Institute does not endorse or promote this organization, nor does it warrant the accuracy or quality of the content contained herein.
Certain information contained herein has been obtained from third party sources and such information has not been independently verified by TSCM. No representation, warranty, or undertaking, expressed or implied, is given to the accuracy or completeness of such information by TSCM or any other person. While such sources are believed to be reliable, TimesSquare does not assume any responsibility for the accuracy or completeness of such information. It does not undertake any obligation to update the information contained herein as of any future date.
Any indices and other financial benchmarks shown are provided for illustrative purposes only, are unmanaged, reflect reinvestment of income and dividends and do not reflect the impact of advisory fees. Investors cannot invest directly in an index. Comparisons to indexes have limitations because indexes have volatility and other material characteristics that may differ from a particular hedge fund. For example, a hedge fund may typically hold substantially fewer securities than are contained in an index.
Certain information contained herein constitutes “forward-looking statements,” which can be identified by the use of forward-looking terminology such as “may,” “will,” “should,” “expect,” “anticipate,” “project,” “estimate,” “intend,” “continue,” or “believe,” or the negatives thereof or other variations thereon or comparable terminology. Due to various risks and uncertainties, actual events, results or actual performance may differ materially from those reflected or contemplated in such forward-looking statements. Nothing contained herein may be relied upon as a guarantee, promise, assurance or a representation as to the future.
U.S. Small Cap Growth: Performance is measured against the Russell 2000® Growth – a market capitalization-weighted index that measures the performance of those Russell 2000® companies with higher price-to-book ratios and higher forecasted growth rates. All indexes, including the Russell 2000® Growth Index, are based on gross-of-fee returns. FTSE Russell is the source and owner of the Russell Index data contained or reflected in this material and all trademarks and copyrights related thereto. Benchmark returns are not covered by the report of independent verifiers.
U.S. Small/Mid Cap Growth: Performance is measured against the Russell 2500 measures the performance of those Russell 2500 Growth – a market capitalization-weighted index that companies with higher price-to-book ratios and higher forecasted growth rates. All Growth Index, are based on gross-of-fee returns. FTSE Russell is the source and owner of the Russell indexes, including the Russell 2500 Index data contained or reflected in this material and all trademarks and copyrights related thereto. Benchmark returns are not covered by the report of independent verifiers.
U.S. Mid Cap Growth: Performance is measured against the Russell Midcap® Growth – a market capitalization-weighted index that measures the performance of those Russell Midcap® companies with higher price-to-book ratios and higher forecasted growth rates. All indexes, including the Russell Midcap® Growth Index, are based on gross-of-fee returns. FTSE Russell is the source and owner of the Russell Index data contained or reflected in this material and all trademarks and copyrights related thereto. Benchmark returns are not covered by the report of independent verifiers.
U.S. FOCUS Growth: Performance is measured against the Russell Midcap® Growth – a market capitalization-weighted index that measures the performance of those Russell Midcap® companies with higher price-to-book ratios and higher forecasted growth rates. All indexes, including the Russell Midcap® Growth Index, are based on gross-of-fee returns. FTSE Russell is the source and owner of the Russell Index data contained or reflected in this material and all trademarks and copyrights related thereto. Benchmark returns are not covered by the report of independent verifiers.
International Small Cap: Performance is measured against the MSCI EAFE Small Cap (Net) Index. MSCI EAFE Small Cap (Net) Index is a trade or service mark of MSCI Inc. The MSCI EAFE Small Cap (Net) Index is an unmanaged, market-weighted index of small companies in developed markets, excluding the U.S. and Canada. Its returns include net reinvested dividends but, unlike the Composite returns shown, do not reflect the payment of sales commissions or other expenses incurred in the purchase or sale of the securities included in the Index. All indexes, including the MSCI EAFE Small Cap (Net) Index, are based on gross-of-fee returns, including net reinvested dividends. Benchmark returns are not covered by the report of independent verifiers.
Global Small Cap: Performance is measured against the MSCI World Small Cap (Net) Index. MSCI World Small Cap (Net) Index is a trade or service mark of MSCI Inc. The MSCI World Small Cap (Net) Index is an unmanaged, market-weighted index of small companies in developed markets. Its returns include net reinvested dividends but, unlike the Composite returns shown, do not reflect the payment of sales commissions or other expenses incurred in the purchase or sale of the securities included in the Index. All indexes, including the MSCI World Small Cap (Net) Index, are based on gross-of-fee returns, including net reinvested dividends. Benchmark returns are not covered by the report of independent verifiers.
Past performance does not guarantee future results.
There is risk that invested capital may be lost. For more information, please contact us at info@tscmllc.com.
(Blue%20%26%20Gold)(Transparent)(2125x844)%20PNG.png)