
November 2026 Newsletter
DOWNLOAD THE PDFFrom firm updates and third-quarter performance to a deep dive on why we believe financials are proving more resilient than feared, our latest Quarterly Newsletter offers a timely look at TimesSquare today and where we’re headed.
Firm Updates
Please join us in congratulating Graig Russo on becoming TimesSquare’s newest Partner! We’re excited to recognize this well-deserved milestone and look forward to his continued contributions to the firm.
Promotions
- Graig Russo: Partner, Head of Business Development (~3 Years with TimesSquare)
Latest Vehicle Launch
TimesSquare Quality Mid Cap Growth ETF (TSCM) This product leverages TimesSquare’s 25-year investment history of creating quality growth portfolios into a tax efficient and transparent ETF structure. We believe TSCM fills the necessary gap of actively managed mid cap growth ETFs being offered in today’s marketplace.
$42.8M AUM (as of 09/30/26)
Read the full Press Release here.
Research Analyst Deep Dive
Financials: More Resiliant Than Feared

Financials are the backbone of the U.S. economy, supporting money movement, risk transfer, and the availability of debt and equity capital that allows the rest of the economy to function and grow. We see key megatrends in financials as firmly intact. Two of the most important enduring themes are the growth and democratization of the private markets ecosystem and the rise of self-directed investing.
Sector Outlook
We see companies within the Financials sector navigating an increasingly complex environment, with varied implications across subsectors. Overall, this environment will create a wide range of opportunities as well as challenges.
- Framing quality and growth in a structurally higher interest rate world. Quality growth principles are as relevant as ever, though their expression in financials may look a bit different.
- Alternative asset managers and the private markets ecosystem are emerging from a period of challenging headlines. We believe business models are proving more resilient than feared.
- The growth of self-directed investing remains a key secular megatrend. While active trader engagement will continue to ebb and flow, we see steadily rising adoption over the coming years.
- We are more cautious about digital assets, stable coins, and tokenized equities. While it remains relatively early days, we see limited moats and/or incremental utility for most digital asset-oriented businesses.
Rethinking Cyclical Financials in a Structurally Higher Rate World
While we are at our core fundamentally driven, bottom-up investors, it’s important to recognize that, for the financials sector, macroeconomic factors (chiefly the overall health of the economy and the shape of the yield curve) are often the most important driver of how our companies, and their stocks, perform. While, as a rule, we avoid having a specific macroeconomic view as a primary driver of our investment thesis, we think it’s important to consider the impact of abroad range of plausible macro scenarios and how they might affect our portfolio.
A key feature of the past couple of years, as distinct from much of the previous decade, is that we have been living in a higher-growth (both nominal and real),higher-interest-rate world. The factors that have gotten us here (namely deglobalization and onshoring, data center capex to support the AI buildout, and persistently high fiscal deficits) seem likely to remain in place for at least the next couple of years, perhaps longer. At the same time, the proliferation of large language models (LLMs) has weakened the perceived moats around some information services and fintech businesses that would historically have checked al of our “quality growth” boxes, leading to persistently lower valuation multiples for these stocks.
Collectively, we see these factors pointing to a solid backdrop (and perhaps also deeper moats) for certain cyclically-geared names such as regional banks and commercial real estate (CRE) brokers that are 1) benefiting from the uptick in economic growth and 2) are either difficult or impossible to replace with AI tools due to some combination of balance sheet intensity, regulatory moats, and/or direct involvement with physical assets (whether in their construction, management, or financing). Consistent with our quality growth principles, we remain highly selective about these names. For example, we avoid banks that have excessive customer or industry concentrations, including banking-as-a-service (BaaS) banks focused on serving fintechs.
Outlook
While investors have been appropriately concerned about the impact of the recent shift higher in rates on bank funding costs and CRE transaction activity, we believe third quarter earnings results point to most of these businesses asmore resilient than feared in the face of an increasingly difficult rate environment.
The Private Markets Ecosystem
The alternative asset managers have faced a challenging backdrop recently, as optimism early in the year about continued improvement in realization activity was quickly replaced by a surge in concerns around valuations for software and related businesses facing the risk of disruption from AI. Semi-liquid private credit vehicles were at the epicenter of these concerns as they faced sharply increased investor redemption requests.
We believe that commentators who drew parallels to the global financial crisis or likened these redemptions to bank runs were somewhat misguided, or at least were exaggerating the risks. The industry has already begun to demonstrate that these fund structures, as well as the underlying investments within them, are in general far more resilient than the popular narrative suggested (helped by broad diversification and appropriate asset-liability matching; the latter is a point we feel much of the financial press got wrong).Fire sales were largely avoided and reduced appetite for these funds from some investors has not translated to a broad-based deterioration in credit availability.
While we believe risks related to prolonged distributed-to-paid-in (DPI) headwinds, slower wealth channel inflows, and performance headwinds for some fund vintages are worth taking seriously, much of this risk is discounted in shares today, with most names trading at wide discounts to historical multiples based on our data. More importantly, we see fee-paying AUM growth, in our opinion the most important KPI, as firmly intact for most managers. Specifically, we see managers with strong performance track records successfully raising flagship funds that are 15-20%+ larger than their predecessors, supporting robust revenue growth and margin expansion (as the fee-paying asset base scales much more rapidly than the required headcount to manage the assets).
Private companies represent a growing portion of the U.S. economy (according to recent research from Oppenheimer, the number of public companies in the U.S. has declined from 8,090 to 3,908), and we believe many companies will continue to choose to go private or stay private for longer. Staying private allows companies to put greater emphasis on managing for the long term without the distraction and conflicting incentives that come with managing public market perceptions and the quarterly reporting cycle. One need only look at the value appreciation of the largest tech companies prior to their IPOs to conclude that many investors would benefit from allocating an appropriately sized portion of their portfolios to private markets. We see the democratization of private markets, including recent regulatory trends in favor of the eventual inclusion of private markets in defined contribution plans, as an important contributor to the next leg of private markets AUM growth.
Consistent with our quality growth principles, we favor balance-sheet-light managers over those that have combined with life insurance companies. While we recognize the appeal of the captive flows that the life insurance model creates, we believe it adds complexity, regulatory uncertainty, and macro/credit sensitivity.
Given our discussion in the previous section, where we said a “higher for longer” rate environment is reasonably likely for the foreseeable future, a natural question is “won’t that create significant headwinds for the alternative asset managers?” While it’s certainly not an incremental positive for most alternative asset managers, we don’t see it as an existential headwind either. Higher interest rates have created an opportunity for debt restructuring, capital solutions, and both GP- and LP-led secondary transactions, secular themes that our portfolios are currently positioned to benefit from.
Outlook
We expect gradual but steady improvement in retail net inflows into private markets (alongside continuing healthy institutional flows), which should put a floor under sentiment and support a recovery in alternative asset manager stocks.
The Global Rise of the Retail Self-Directed Investor
According to the Fed’s 2025 Survey of Consumer Finances, only 56% of adults are direct or indirect participants in the stock market, while penetration outside the U.S.is generally even lower. With the generational wealth transfer well underway, we see the scope for younger, digitally native investors managing a greater share of their wealth on self-directed platforms. Agentic wealth management solutions remain early in their evolution, but we see the potential for them to support a broader swath of investors managing their own finances, including those who would like more guidance in financial planning but may not need or want a full-service advisor.
While we continue to see a very important place for human advisors for the foreseeable future, especially for larger customers with more complicated needs, we see the rising cost of advisor recruiting and retention, as well as uncertainty about how brokers will earn income on customer cash balances, potentially creating volatility in the stock prices of traditional wealth managers. As a result, our portfolios tend to lean toward self-directed platforms.
Outlook
Retail brokers’ stocks have pulled back from their highs, which we mainly attribute to some slowing of trading activity since the summer. We are not too surprised by that slowing, because a very active period for retail engagement in the early part of the year, supported by several marquee tech IPOs, gave way to choppier markets and some fatigue in the AI trade. Despite the recent slowing, we continue to be encouraged by healthy new account acquisition, customer asset growth and the development of new product offerings such as agentic trading that serve an ever-broadening range of investor needs.
Areas of Caution: Staying Grounded in Quality
As investors, our performance will often be defined as much by the things we choose not to invest in as by those that we do. In this regard, we want to highlight the areas of the financials ecosystem where we are more cautious or under weight. As quality growth investors, we avoid businesses with unsustainable capital structures, regulatory uncertainty, and unclear moats.
We are cautious about stable coin-focused companies and believe the limited market-cap growth of the major stable coins suggests they are not gaining more widespread adoption outside of crypto trading. At the same time, we see traditional banks seeking to defend their position by more actively promoting tokenized deposits, which replicate many of the desirable features of stable coins (e.g., instant settlement).
We are skeptical of the introduction of perpetual futures (“perps”) to the U.S., which we view as analogous to the highly levered contract-for-difference (CFD) products popular in some international markets. The issue we see with the excessive leverage enabled by these products is that a large percentage of traders will lose all o their capital, making this a less sustainable source of asset growth and inherently deserving of a lower multiple (as we see for European brokers with large CFD-type businesses).
While we have similar concerns about the binary nature of prediction market contracts, we do see a variety of incremental use cases that could appeal toretail and professional investors, insurers and other financial intermediaries, and commercial companies across the size spectrum.
Outlook
The current regulatory environment has supported the rapid growth and development of several new asset classes and trading products. While an environment that supports innovation and experimentation is a positive, we see limited incremental growth opportunity for many of these newer products. Of the newer financial products that have grown rapidly over the past couple of years, we see prediction markets as having the most promise.
Bottom Line
While the macro and political environment remain in flux, we see a robust outlook for many of the major subsectors within financials over the next couple of years.
Strategy Performance
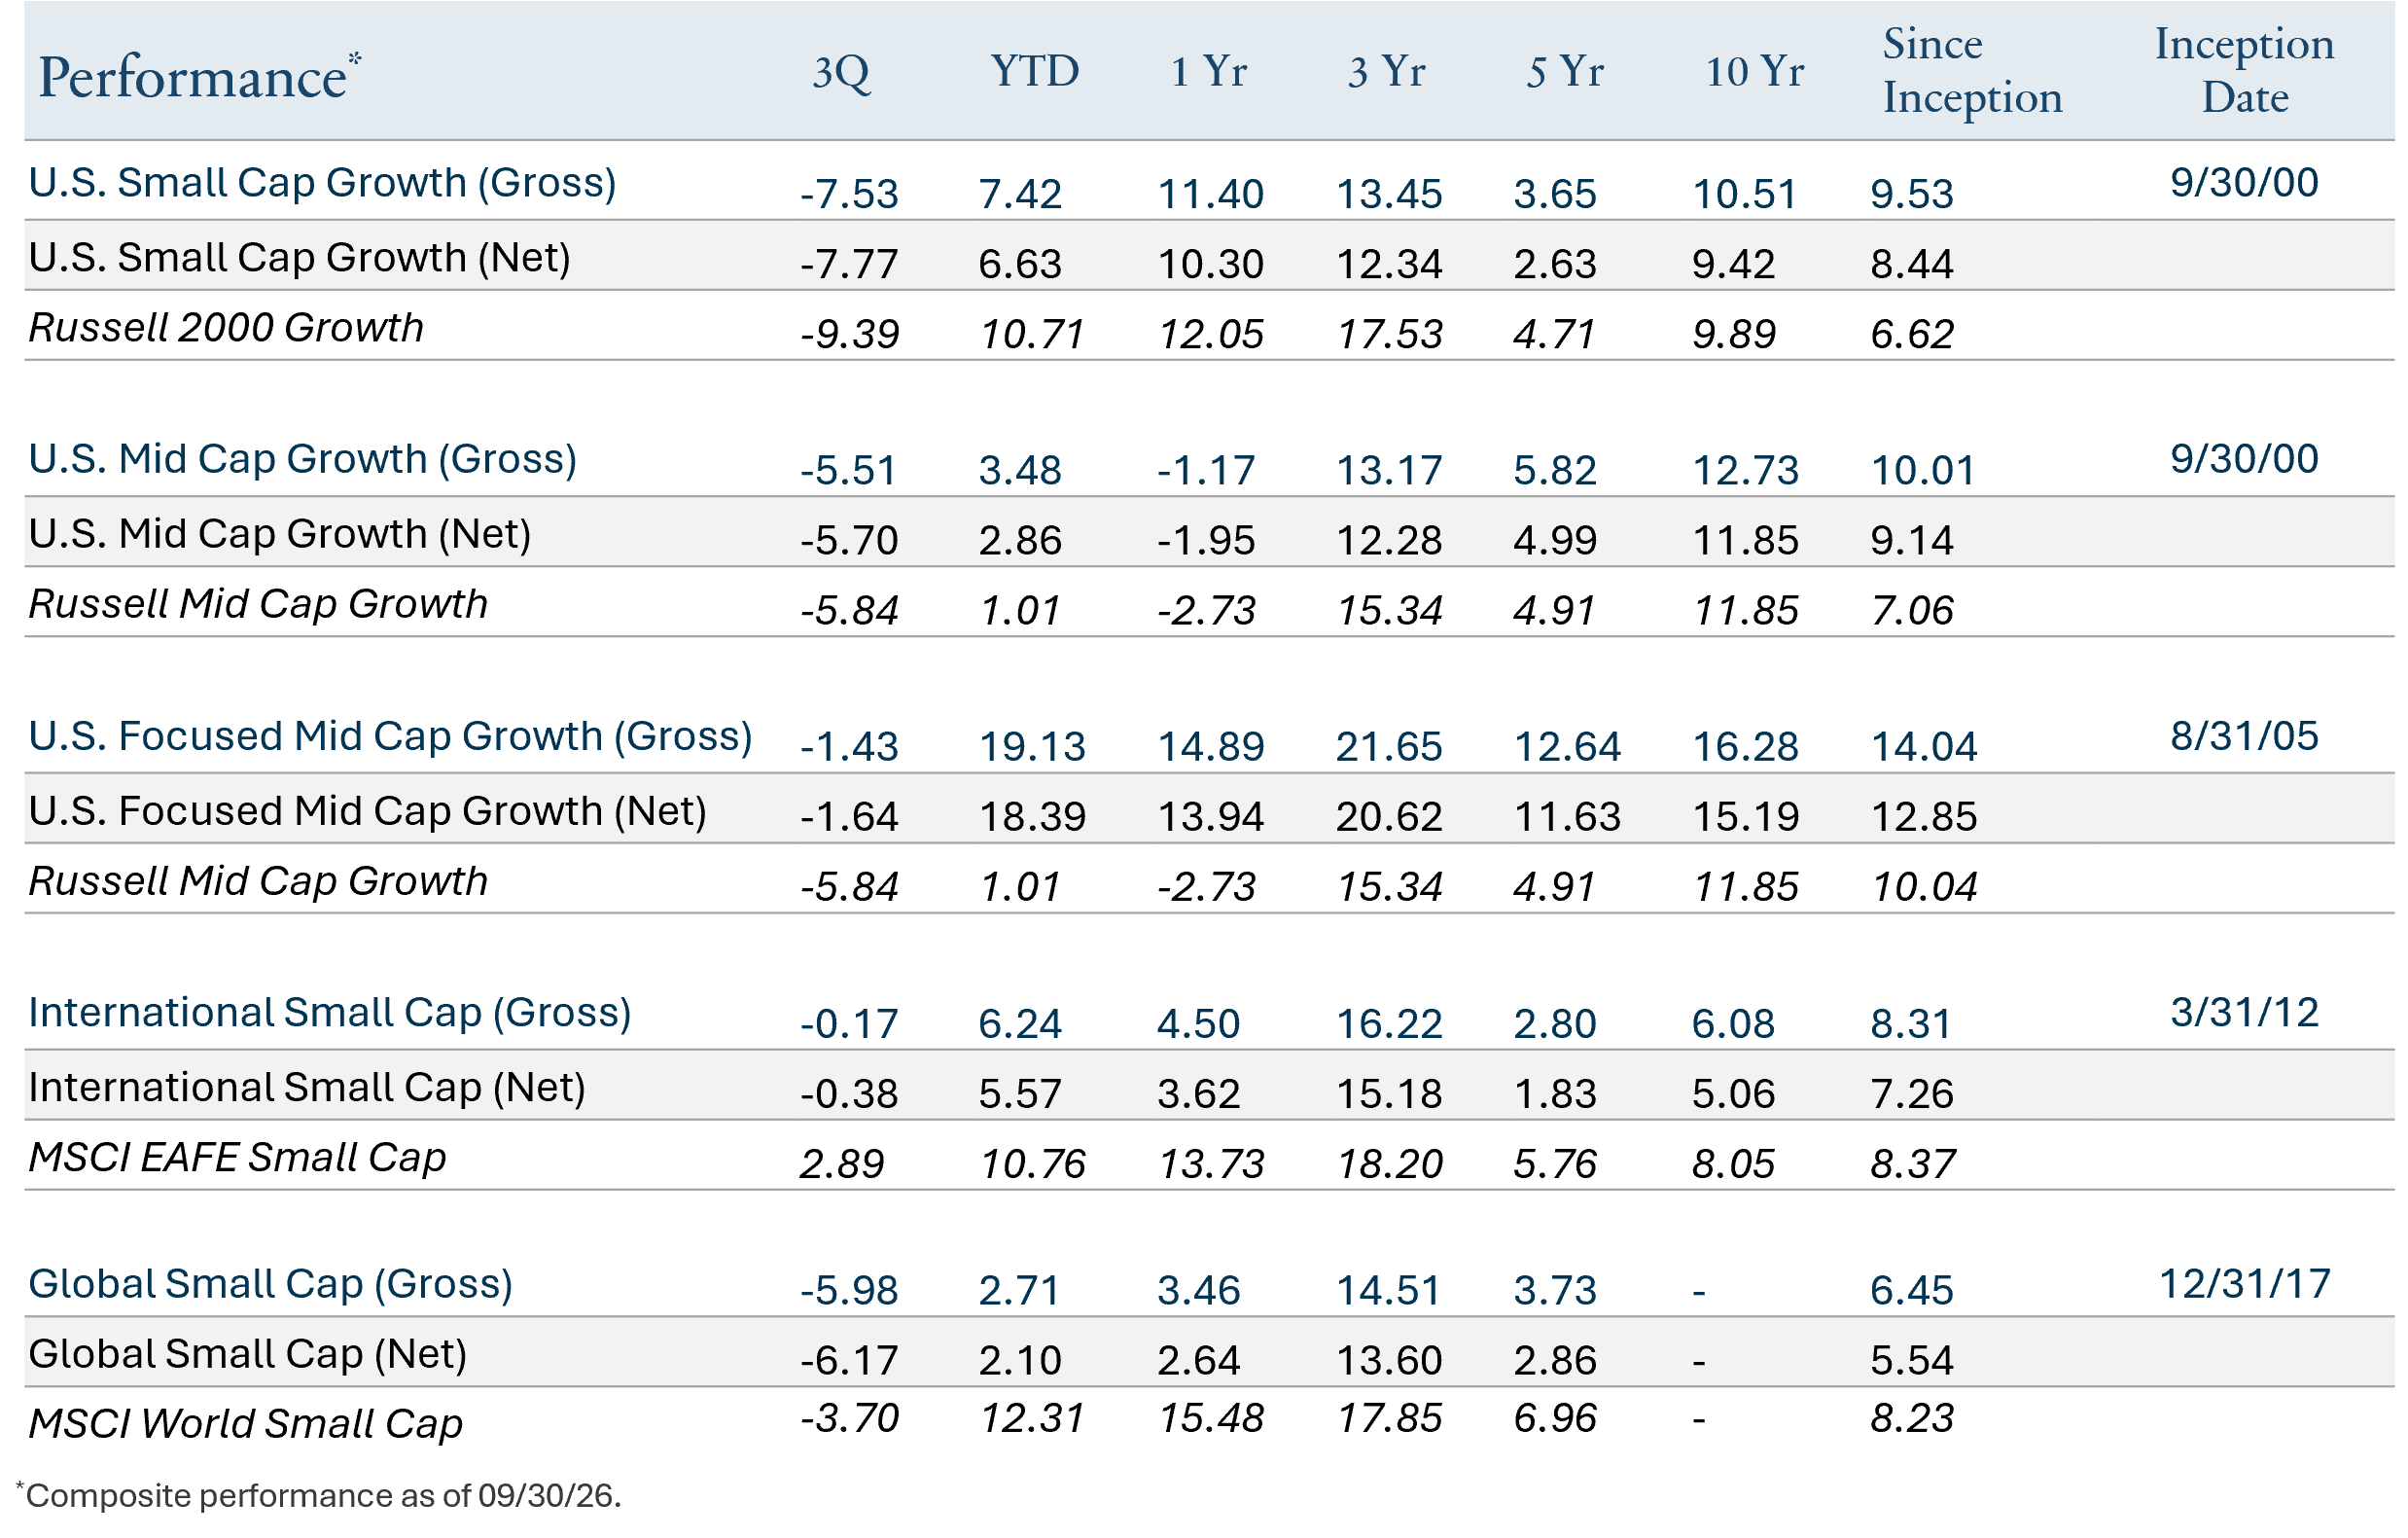
Annualized for periods greater than one year. See important disclosures.
Updated Profiles & Commentaries Here
TimesSquare News & Insights
Pitch the PM Podcast, featuring Edward Salib
Edward Salib, Co-Portfolio Manager of the TimesSquare Quality Mid Cap Growth ETF (NASDAQ:$TSCM),joins host Doug Garber to make the case for one of his highest conviction names, DoorDash (NASDAQ: $DASH). Drawing on nearly 25 years at the firm, Ed explains why a business TimesSquare once passed on became a core holding, and how patience and disciplined research created the opportunity.
Interview with Sonu Chawla, CFA: The Wall Street Transcript
In this Wall Street Transcript interview, TimesSquare Portfolio Manager Sonu Chawla, CFA, breaks down her high-conviction mid-cap holdings — including Snowflake, Curtiss-Wright, Carpenter Technology, and Interactive Brokers — and explains why mid-caps remain an alpha-rich hunting ground in the AI era.
Leaders at the Bell: An Interview with Joshua Bischoff
From the floor of the NYSE, TimesSquare's Joshua Bischoff breaks down how disciplined investors trade illiquid small- and mid cap names, manage risk, and find opportunity beyond big tech.
Inside the Investment Room (October 2026)
In this edition of Inside the Investment Room, we explore how shifting market leadership, evolving AI investment trends and persistent cost pressures are shaping opportunities across small- and mid cap equities.
Disclosures
TimesSquare Capital Management LLC is a growth equity specialist that is registered as an investment adviser with the U.S. Securities and Exchange Commission and is majority owned by Affiliated Managers Group, Inc. With an experienced investment team and rigorous fundamental analysis, we identify high quality companies with strong management in inefficient market cap ranges. As a boutique, our highly collaborative process and integrated approach promote our commitment to meeting our clients’ service needs. Importantly, employees share a common economic interest through equity participation aligning them with the success of our clients and the firm.
This material is for your private information and is provided for educational purposes only. The views expressed are the views of TimesSquare Capital Management, LLC only through the period ended Ocotber 2026 and are subject to change based on market and other conditions. The opinions expressed may differ from those with different investment philosophies. The information we provide does not constitute investment advice and it should not be relied on as such. It should not be considered an offer or solicitation to buy or an offer to sell a security. It does not consider any investor’s particular investment objectives, strategies, tax status or investment horizon. We encourage you to consult your tax or financial advisor. All material has been obtained from sources believed to be reliable, but its accuracy is not guaranteed. There is no representation or warranty as to the current accuracy of, nor liability for, decisions based on such information. Specific investments described herein do not represent all investment decisions made by TimesSquare. No assumption should be made that investment decisions identified and discussed were or will be profitable. Specific investment advice references provided herein are for illustrative purposes only and are not necessarily representative of investments that will be made in the future.
TimesSquare Capital Management, LLC claims compliance with the Global Investment Performance Standards (GIPS®) and is independently verified. A firm that claims compliance with the GIPS standards must establish policies and procedures for complying with all the applicable requirements of the GIPS standards. Verification provides assurance on whether the firm's policies and procedures related to composite and pooled fund maintenance, as well as the calculation, presentation, and distribution of performance, have been designed in compliance with the GIPS standards and have been implemented on a firm-wide basis. Policies for valuing investments, calculating performance, and preparing GIPS Reports are available upon request. GIPS® is a registered trademark of CFA Institute. CFA Institute does not endorse or promote this organization, nor does it warrant the accuracy or quality of the content contained herein.
Certain information contained herein has been obtained from third party sources and such information has not been independently verified by TSCM. No representation, warranty, or undertaking, expressed or implied, is given to the accuracy or completeness of such information by TSCM or any other person. While such sources are believed to be reliable, TimesSquare does not assume any responsibility for the accuracy or completeness of such information. It does not undertake any obligation to update the information contained herein as of any future date.
Any indices and other financial benchmarks shown are provided for illustrative purposes only, are unmanaged, reflect reinvestment of income and dividends and do not reflect the impact of advisory fees. Investors cannot invest directly in an index. Comparisons to indexes have limitations because indexes have volatility and other material characteristics that may differ from a particular hedge fund. For example, a hedge fund may typically hold substantially fewer securities than are contained in an index.
Certain information contained herein constitutes “forward-looking statements,” which can be identified by the use of forward-looking terminology such as “may,” “will,” “should,” “expect,” “anticipate,” “project,” “estimate,” “intend,” “continue,” or “believe,” or the negatives thereof or other variations thereon or comparable terminology. Due to various risks and uncertainties, actual events, results or actual performance may differ materially from those reflected or contemplated in such forward-looking statements. Nothing contained herein may be relied upon as a guarantee, promise, assurance or a representation as to the future.
U.S. Small Cap Growth: Performance is measured against the Russell 2000® Growth – a market capitalization-weighted index that measures the performance of those Russell 2000® companies with higher price-to-book ratios and higher forecasted growth rates. All indexes, including the Russell 2000® Growth Index, are based on gross-of-fee returns. FTSE Russell is the source and owner of the Russell Index data contained or reflected in this material and all trademarks and copyrights related thereto. Benchmark returns are not covered by the report of independent verifiers.
U.S. Mid Cap Growth: Performance is measured against the Russell Midcap® Growth – a market capitalization-weighted index that measures the performance of those Russell Midcap® companies with higher price-to-book ratios and higher forecasted growth rates. All indexes, including the Russell Midcap® Growth Index, are based on gross-of-fee returns. FTSE Russell is the source and owner of the Russell Index data contained or reflected in this material and all trademarks and copyrights related thereto. Benchmark returns are not covered by the report of independent verifiers.
The performance figures shown for U.S. Small Cap Growth and U.S. Mid Cap Growth are calculated in U.S. dollars on a size-weighted basis and reflect there investment of dividends and other earnings, and the deduction of brokerage commissions and other transaction costs. Performance is provided on a gross basis (before the deduction of management fees) as well as net of the highest fee level from the standard fee schedule listed for this strategy during the period presented. The U.S. Small Cap Growth fee basis is 100 basis points, and the U.S. Mid Cap Growth fee basis is 80 basis points. Investment advisory fees generally charged by TimesSquare are described in Part 2A of its Form ADV.
U.S. Focused Mid Cap Growth: Performance is measured against the Russell Midcap® Growth – a market capitalization-weighted index that measures the performance of those Russell Midcap® companies with higher price-to-book ratios and higher forecasted growth rates. All indexes, including the Russell Midcap® Growth Index, are based on gross-of-fee returns. FTSE Russell is the source and owner of the Russell Index data contained or reflected in this material and all trademarks and copyrights related thereto. Benchmark returns are not covered by the report of independent verifiers.
The performance figures shown for U.S. Focused Mid Cap Growth are calculated in U.S. dollars on a size-weighted basis and reflect there investment of dividends and other earnings, and the deduction of brokerage commissions and other transaction costs. Performance is provided on a gross basis (before the deduction of management fees) as well as net of the highest fee level from the standard fee schedule listed for this strategy during the period presented. From January 1, 2007to April 30, 2010the applied standard fee was 150 basis points. From May 1, 2010through December 31,2023, the applied standard fee was 100 basis points. From January 1, 2024through present, the applied standard fee is 85 basis points. TimesSquare’s fee schedule is available upon request and may also be found in Part 2A of our Form ADV.
International Small Cap: Performance is measured against the MSCI EAFE Small Cap (Net) Index. MSCI EAFE Small Cap (Net) Index is a trade or service mark of MSCI Inc. The MSCI EAFE Small Cap (Net) Index is an unmanaged, market-weighted index of small companies in developed markets, excluding the U.S. and Canada. Its returns include net reinvested dividends but, unlike the Composite returns shown, do not reflect the payment of sales commissions or other expenses incurred in the purchase or sale of the securities included in the Index. All indexes, including the MSCI EAFE Small Cap (Net) Index, are based on gross-of-fee returns, including net reinvested dividends. Benchmark returns are not covered by the report of independent verifiers.
Global Small Cap: Performance is measured against the MSCI World Small Cap (Net) Index. MSCI World Small Cap (Net) Index is a trade or service mark of MSCI Inc. The MSCI World Small Cap (Net) Index is an unmanaged, market-weighted index of small companies in developed markets. Its returns include net reinvested dividends but, unlike the Composite returns shown, do not reflect the payment of sales commissions or other expenses incurred in the purchase or sale of the securities included in the Index. All indexes, including the MSCI World Small Cap (Net) Index, are based on gross-of-fee returns, including net reinvested dividends. Benchmark returns are not covered by the report of independent verifiers.
The performance figures shown for International Small Cap and Global Small Cap are calculated in U.S. dollars on a size-weighted basis and reflect there investment of dividends and other earnings, and the deduction of brokerage commissions and other transaction costs. Performance is provided on a gross basis (before the deduction of management fees) as well as net of the highest fee level from the standard fee schedule listed for this strategy during the period presented Actual fees may vary depending on, among other things, the applicable fee schedule and portfolio size. The Global Small Cap inception to December 31, 2023, fee basis is 90 basis points. From January 1, 2024, the fee basis is 80 basis points. The composite creation and inception date is January1, 2018. The International Small Cap inception to December 31, 2024fee basis is 100 basis points. From January 1, 2025, the fee basis is 85 basis points. The composite creation and inception date is April 1, 2012.TimesSquare’s fee schedule is available upon request and may also be found in Part 2A of our Form ADV.
Past performance does not guarantee future results.
There is risk that invested capital may be lost.
For more information, please contact us at info@tscmllc.com.
